Chart Patterns in the Stock Market

Introduction
Price movement represents an important factor investors look at when considering investing in the stock market. The fundamental analysis provides information on how well the company operates financially, while the technical analysis deals with price movements or the way in which prices change over time. One of the primary tools used by technical analysts to identify trends within a stocks price chart is through chart patterns. A chart pattern represents a visual appearance on a stock price chart that indicates to traders where future price movements of the stock may occur.
Charts have long been present in the trading world, providing guidance on movement of prices for nearly a hundred years. The basis for all trading chart patterns stems from that knowledge that historic events repeat themselves; the principle is simple, that price movements will create patterns due to similar psychological and emotional responses from traders and investors because of their own actions. Fear and greed basically drive the majority of what occurs within all markets, therefore, in essence, the chart patterns provide a view of the fear and greed from trader’s perspective over time.
No matter where you are, at this time, as a trader, if you are new and just beginning or if you are already an advanced trader with many years of experience under your belt and just trying to perfect your skills, learning chart patterns is extremely critical. The information contained within this document provides an overview of everything a trader should be aware of when it comes to chart patterns; from what they actually are to why they matter and finally the most important chart patterns every trader should learn.
What is a chart pattern?
Chart patterns are basically clear-cut forms or shapes made up of price movement in a particular stock for a certain period of time. These chart patterns are plotted on price charts (most commonly either on Candlestick Charts or Bar charts) and assist traders in identifying possible buying or selling points.
each of the pattern of story will fight between the buyer and seller, the buyer is strong and price will go up, the seller is strong and price will go down, they are equal and the price will go sideway, from the pattern we can monitor the buyer and seller fight, and we can know what price will move next from the previous movement
There is three major categories of chart patterns they are:
1. The reversal patterns are indicative of the current trend changing direction. When the stock price is in an uptrend, it is an indication that it will be reversed to go down and vice versa.
2. The continuation patterns can come in the form of retracements after a period of consolidation and represent the possibility of reproduction of the prevailing trend.
3. In addition, patterns may be bilateral; meaning that they may personally go in either direction, thus, they would be considered as a neutral signal until there is a definite breakout.
The Importance of Chart Patterns:
(1) Indicate Price Movement:
Chart patterns are used as a tool for traders to estimate the movement of prices within the market. A chart pattern may not provide a 100% accurate prediction; however, if it is a High Probability Chart Pattern, it will greatly increase your chances of successfully trading based on this pattern.

2) Entry and Exit Signal Points:
Chart Patterns indicate when you should enter a position. i.e. Buy, and when you should exit your position.
Market Psychology: Chart patterns provide a “snapshot” of market psychology at that moment (e.g., bullish, bearish, neutral, or diapason) and therefore help traders determine whether it is bulls/buyers or bears/sellers who are in control.
Risk Management: Many patterns possess built-in stops (e.g., the lows of the day for a double-bottom pattern) to limit losses in the event of failure.

All Markets: Chart patterns are applicable in virtually all markets, including stocks, commodities, Forex and the cryptocurrency markets, so, the developing of expertise in using these patterns can be very useful for all areas of trading.
The major reversal chart patterns include:
Reversal Patterns represent one of the most significant and most commonly observed patterns in technical analysis. They signify the conclusion of an existing trend and the commencement of a new trend.
1. Head & Shoulder Pattern :
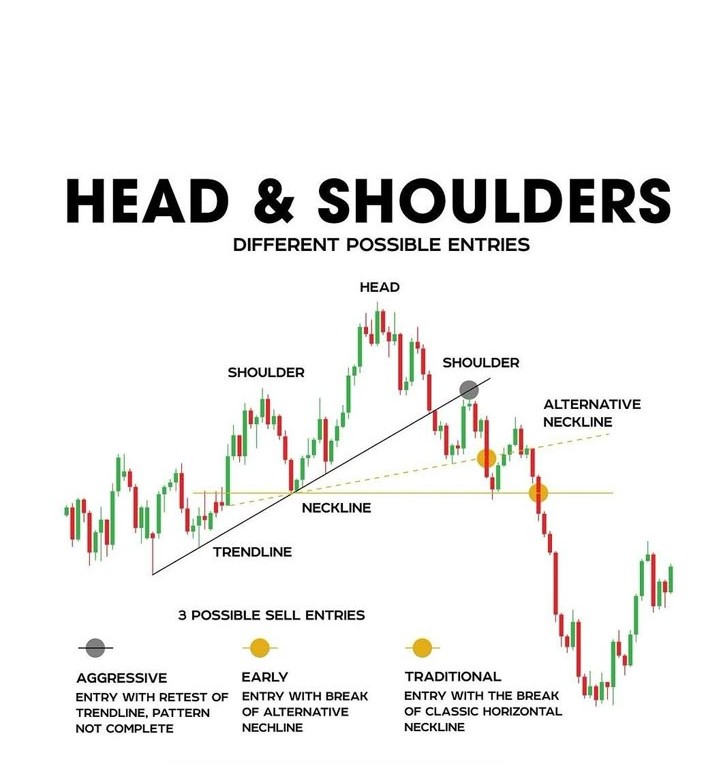
The head and shoulder pattern is among the best known and most dependable reversal patterns in technical analysis. The head appear at its highest peak, while the two shoulder appear at their lowest peak. The left and right shoulders have nearly equal heights; the head rises above both.
Draw a line between the two points on either side of the point that makes the Head and shows where it is. when the price falls below the neckline after the right Shoulder, there is confirmation that the reversal trend is Bearish, the uptrend has ended, and the downtrend has started.
The Inverse Head and Shoulders forms at the base of a downtrend (the exact opposite of the Head & Shoulders Pattern) and is a representation of a bullish reversal (downtrend to uptrend); once confirmed, it is a definitive indication that the downtrend is coming to an end and a new uptrend is developing. It is generally considered to be one of the most powerful buy patterns in technical analysis.
To calculate the price target for the Inverted Head and Shoulders Pattern, measure the vertical distance between the head and the neckline. Once the neckline has been broken, this distance is then added to the breakout level to establish a price target for the security.
The Inverse Head and Shoulders Pattern is produced by measuring from the head to the neckline and continuing that measurement from the breakout point.
2. Double Top and Double Bottom:
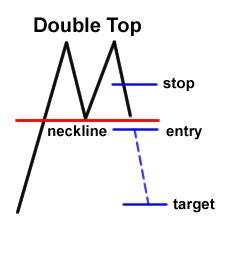
A Double Top pattern is a reversal pattern that appears on the chart to show bearish trends alongside other reversal patterns. The Double Top pattern occurs where the price of security reaches a specific resistance point, drops, rises again at the same point or just a little lower than the first, and then declines completely. This forms the ‘M’ shape, and the two peaks’ prices do not have to be exactly the same. The downward trend is likely to continue after a Double Top is confirmed by price breaking through (or closing below) the neckline applying the other occurrence of a Double Top Pattern.

A double bottom occurs when the price is in a downtrend and must hit a level of support twice before continuing higher due to the buying pressure from traders at those levels of support. The pattern resembles the letter “W” because price action bounces off support, then drops back to that same level again before it continues up. Once the price moves above the highest point between the two lows, it is confirmed as a valid pattern indicating an uptrend.
Volume spike on breakout confirms reliability of either pattern that appear after a long-term trend.
3. Triple Top/Bottom:

The Triple Top is very similar to the Double Top or the Bottom. Like with the Double Top, the price experiences three peaks at resistance before it breaks below support and continues in a strong downward direction. After each failure, the buying pressure weakens.
The Triple Bottom is a pattern that is like the inverse of the triple top, where there are three unsuccessful moves below a support line, which are then followed by a powerful upward move. While these patterns do take quite a while to develop, they are a great indication of reliability.
4. Rounding Bottom (Cup Pattern):

The Rounding Bottom pattern is the “U-shaped pattern” or the Cup pattern:it is basically a long-term bullish reversal pattern. The price will decrease slowly before hitting bottom in a curved, bowl-like shape will then increase through the previous high on an uptrend. The addition of a handle to the Rounding Bottom produces one of the biggest bull continuation signals in the stock market-the Cup and Handle pattern.
Continuation patterns develop at the time of pause occurred in ongoing trends. As soon as the pause occurs, it signals that the trend will continue with the same direction once the pause is over.
5. Flags and Pennants:

Flags and Pennants: they are considered to be very short-term continuation patterns that appear after a big move in price either up or down. The big move associated with these kinds of patterns is sometimes referred to as the ‘flag pole’. The price continues to consolidate after its initial move and does so within a very small rectangular channel, that is generally sloping against the overall or prevailing trend. Once the price breaks out of the channel, in that same direction as the original move, the trend is considered to be continuing.
A bull flag pattern forms after a significant rise in price and trails downward. In contrast, a bear flag pattern forms after a significant downturn in price and tapers upward.
Pennants are very similar to flags, but instead of the consolidation phase being a rectangle, i.e., the flagpole, the consolidation in pennants creates a small, symmetrical triangle. Pennant patterns are very common in a trending stock and usually will break out quickly and with a lot of force.
6. Ascending, Descending, and Symmetrical Triangles Cost:
stock Triangles are some of the most commonly seen chart patterns in the stock market.

Ascending Triangle: You have a horizontal resistance line at the top with an ascending support line at the bottom. The buyers are pushing the price up continuously and once it breaks the horizontal resistance line, you’re going to see a bullish breakout.
Descending Triangle: The support line at the bottom is horizontal, while the resistance is descending from above. The sellers are pressing the prices to the downside on every retracement and once the breakdown of the horizontal support line occurs it’s a bearish breakout.
A symmetrical triangle forms when two trendlines:one going down (the top line) and one going up (the bottom line), start to move towards each other and get closer together. Symmetrical triangles can break out to the upside or downside, so traders will usually wait for an entry signal after the breakout occurs.
7. Wedges:

Rising Wedge: Here, the resistance and support lines move upward, but the support line (bottom) moves up faster than the resistance line (top). Even though the price is moving up, this wedge pattern is bearish because of how price is converging. Once the price goes below the support line, it is an indication that the price will go down quickly.

Wedge Falling It is a wedge formation where both the trendlines tilt downward while the upper trendline declines more rapidly than the lower one. It is a bullish formation. If the price breaks above the upper trend line, it would be an indication that the price might increase significantly.
Rectangle Pattern:

A rectangular price pattern forms when the price trades laterally between two parallel horizontal trendlines, the upper resistance line, the lower support line. As price moves within this range it reflects balance between the buyers and the sellers. At some point one of the two sides wins, causing breakout of prices from the rectangle pattern (either in the case of continued upward trend if breakout occurs from upper boundary, or in case of continued downward trend in the case of breakout through the lower support level).
Candlestick Patterns in Chart Analysis:
In addition to the larger chart pattern noted above, candlestick pattern represent yet another very important aspect of technical analysis of the stock market. Candlestick pattern are short-term patterns composed of one candle, two candle, or three candle.
Here are some important candlestick patterns: Doji , Hammer, and Shooting Star; in addition to these, there are Bullish Engulfing and Bearish Engulfing patterns, and also Morning Star and Evening Star which are both three-candle reversal patterns. Candlestick patterns are typically used together with larger chart patterns to generate a higher probability of making accurate trading entry or exit decisions.
Tips to Follow to Trade Chart Patterns Successfully
Once you have identified the patterns you’ve got to have discipline in your approach to trading them.
Do not open a trade until you receive a confirmation: Entering a trade element on an incomplete pattern is very risky. Before entering your trade, always wait for a Confirmed breakout or breakdown. Do not enter a trade based on an incomplete pattern. Trading based on incomplete patterns may lead you into many false signals since many traders find it hard to wait patiently.
Utilize volume as confirmation: Volume is an important element that should be considered in conjunction with price action when entering a trade. If the price breakout occurs on high volume it is much more reliable than if the breakout occurred on low volume. The volume will show you the strength and conviction of the movement of the price.
Set a Price at Which You Aim to Sell: All patterns will have a measured price point that you can use as your goal. An example of this would be a head and shoulders pattern, in which the price goal would be measured from the head to the neckline and then the distance between the two would be projected downward from the point of breakout. You must know where you want to take your profits prior to entering any trade.
Establish a Stop-Loss: Make sure you always use a stop loss to ensure you’re protected if there is a pattern failure. Normally, for bullish breakout situations, a stop loss will be placed slightly below the breakout area. This approach helps control your risk but at the same time gives the trade room to evolve.
Use it With Other Indicators: Chart patterns are most effective when they are evaluated together with other technical indicators, including Moving averages, RSI (Relative Strength Index), MACD and Bollinger Bands. These tools can give confirmation of buy and sell signals and they can eliminate false breakout signals.
Never forget the whole market’s bigger picture: If the overall market is in an uptrend (bull market), a bullish pattern will be more reliable than if the pattern is in a downtrend (bear market). Be sure to consider both your overall market and sector trends when trading patterns!
Common Mistakes Traders Make in Trading Patterns
There are a number of mistakes that traders commonly make while they are trading patterns:
Forcing patterns: Just because you see something moving in price doesn’t mean there is a valid pattern. Do not attempt to see patterns if patterns are not completely obvious.
The Volume Negligence: The trading activities could lead to significant losses if you are trading breakouts without checking the volume of the trades. You must confirm the breakouts with the trading volumes before you initiate the trades.
Stop-Loss Negligence: One of the most fatal trading mistakes for any trader is in trading without a stop-loss. The primary objective here remains the protection of your capital at all times.
The Over-Trading: Not every pattern that emerges must be traded. Be very selective about the Patterns, and you must wait for the patterns that offer maximum quality standards.
Conclusion:
Chart Patterns are a simple but effective way to look at price movements in stocks. Chart patterns allow traders to make informed trading decisions using visuals that reflect the psychology of the market. Patterns such as the Head and Shoulders and Flag Patterns provide an understanding of the battle between buyers and sellers.
Yet, there is no pattern that is accurate in all situations. The stock markets are a function of many things (news stories, reports of economic events, the activities of large investors, and trends in other parts of the world). Chart patterns provide guidelines; however, they are not set in stone. The best traders use three things: (1) they use patience, (2) they use pattern recognition, and (3) they use good sound money management practices. and finally (4) They are always learning.
To begin training your eye to see a chart pattern, learn a handful of patterns inside and out, then historical charts and slowly increase your charting skill. If you invest dedication and discipline into a chart pattern, it becomes a powerful tool to help you be successful in the Stock market.