Structure Mapping

Introduction
Structure Mapping is basically the groundwork for technical trading (trading based on prices). Market Structure Analysis looks at the pattern of highs and lows to determine whether the price of the stock is in an upward trend, downward trend or a sideways trend, typically on a chart. While indicator traders use mathematical formulae created from historical prices (such as moving averages, RSI or MACD etc.) to guide them in their trading decisions, Structure Mapping dealers use only pure price action to take their trading decisions. The people that apply structure mapping to their trading can read a chart just like a sailor can read the wind (based on supply and demand, rather than lagging indicators).
The note describes what structure mapping is and why it is important, lists the fundamental components, and tells how structure mapping can be used in practice, and lists some of the common errors that can occur when using the method.
Definition of Market Structure:
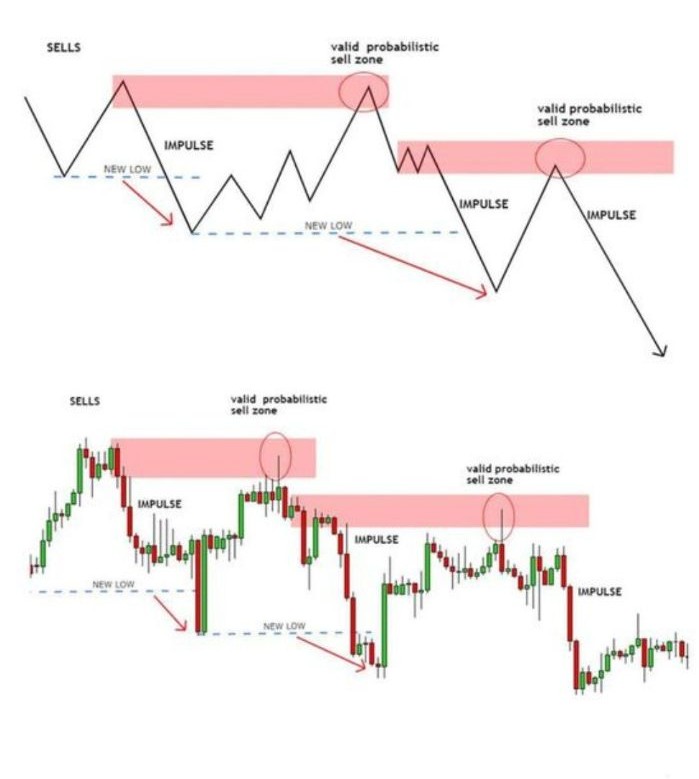
The market structure can be defined as the underlying skeletal form of the price movement patterns. Basically, all charts, regardless of the timeframe, will have a succession of price movements, either upwards and then backwards and then again upwards (or vice versa during a downward trend), which will appear to form certain patterns of price movement.
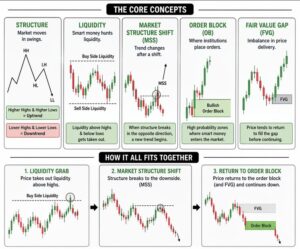
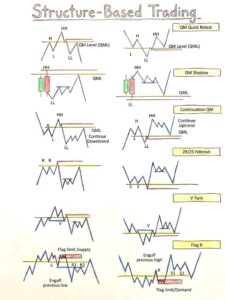
Uptrend structure are represent by HH (Higher Highs) and HL (Higher Lows). In a uptrend, each rally is higher than its previou peak (high point), and each pullback occur to a level above where the last pullback occurred.
Downtrends structure is defined by LH (Lower Highs) and LL (Lower Lows). In a downtrend, every drop goes farther down from where it dropped last time, and every recovery doesn’t go as high as the previous recovery.
(Trading) Range or Consolidation pattern is when price ranges between two set horizontal lines – resistance as the “ceiling” and support as the “floor” without making higher highs and lower lows consecutively.
Structure mapping consists of the process that allows us to label swing points in real-time on a chart so we know what “regime” the market is in before placing a trade.
The Importance of Structure Mapping:
Context precedes the breakout signals: A trend breakout, moving average crossover, and oversold RSI readings differ a lot between an uptrend and a downtrend. While traders use many tools to trade, the structure helps provide context to all those other tools.
Objective Trend Definition – instead of simply guessing what sort of mood (bullish or bearish) a stock is in, structure provides the answer with rules based on the fact that when there continues to be higher highs and higher lows, an upward trend exists and once this pattern has been broken, a change in trend may have occured.
Entry and Exit Framework – the entry and exit methods used by many professional traders are built solely on structure; for example, buying pullbacks to higher lows during an uptrend and covering shorts after rallies have created lower highs in an overall downward trend.
Risk Control: The best way to analyse the risks involved in trading is to swing highs and lows, which are natural places to place stops because once the emergence structure has been surpassed, the system of trading is no longer valid.
Filtering Noise: The process of structure mapping compels a trader to look at the price in the form of swings and not just on a candlestick-by-candlestick basis, and hence it minimizes the likelihood of overtrading and reacting emotionally.
The fundamental elements of structure mapping:
1. Swing highs and Swing lows

The swing high is a candle (or price bar) with lower highs on both sides. The swing low is a candle with higher lows on both sides. The pivot points form the basic structure used to create maps. Normally, traders can identify them by looking at charting software, while others use a certain number of bars (for example 5-bar fractal) to objectively determine if there is a swing point.
2. Break of Structure (BOS)

A Break of Structure happen when price break through the previou swing high or swing low, indicating that the direction of the trend is still continuing. For example, if the trend is upward and price move above the recent swing high, it is a bullish BOS, signalling that buyers have control.
3. Change of Character (CHoCH)

A character shift is an indication that a previous trend has started to reverse when a price has fundamentally broken the structure of the prevailing trend in the opposite direction. In an uptrend, for example, the upward movement breaks down when it reaches the next higher low rather than continuing upward with another new higher high. While this does not indicate a reversal in the direction of the prevailing trend, it represents the earliest objective indication of such a reversal.
4. Support and Resistance Zones

Price tends to “test” specific levels repeatedly after swing points are mapped. The levels become support (price floor) and resistance (price ceiling). Structure mapping will generally look at support and resistance zones as supply and demand imbalanced areas instead of linear lines because markets rarely respect the same price level to the penny.
5. Trendlines and Channels
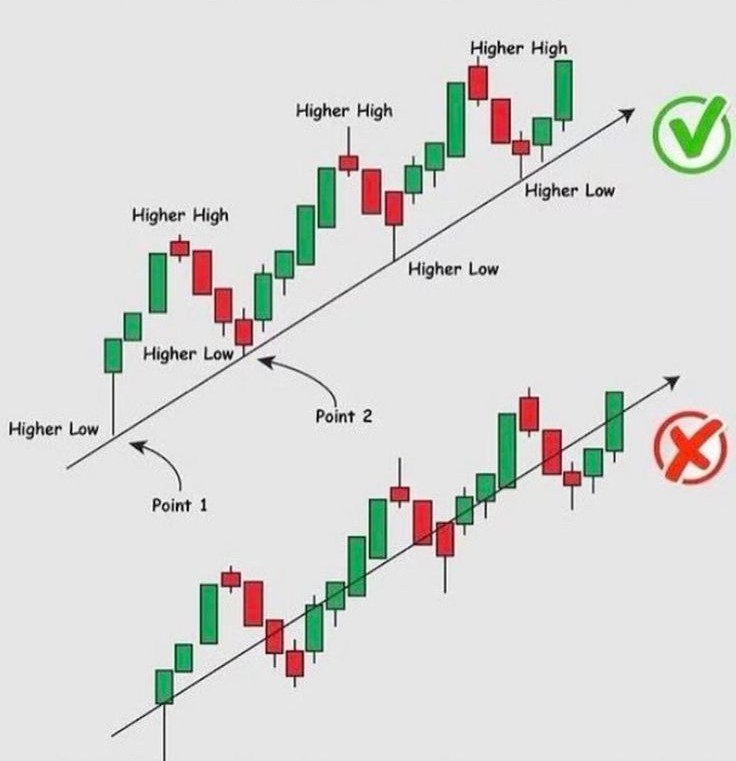
When you join higher lows together (when the stock is moving up) or lower highs (when the stock is falling) by a line, the trendline will provide a sloping support or resistance level, as opposed to a horizontal support or resistance level. If you draw a second parallel line, this will form a channel, where you can predict the next area that may potentially reverse.
6. Multiple Timeframe Structure

A stock can see an uptrend on one measure (weekly) while at the same showing a downtrend (hourly). Experienced traders would coordinate their technical analysis between two timeframes, usually an upper timeframe for greater invariance and lower timeframe for the entry point. The main idea of this approach is to trade with the prevailing trend instead of against it.
How to Get Structure Mapping Into the Stock Market
Step 1 : Determine the timeframes that you are going to utilize. The timeframe that you would determine your ‘bias’ (like daily or weekly) and the timeframe that you would perform your analysis to enter (like 1-hour or 15-minute), depending on your style of trading (positional, swing, or intraday).
Step 2 : Mark down the swing points that are visible on the chart; you are going to do this from left to right on the chart, and you are going to identify each swing high and swing low that are considered significant. Do not mark down excessive amounts of small wiggles as this will not represent the rhythm of the stock and will show all of the movements of the price as a structure when in fact they are not.
Step 3:The trend should be determined according to the labelled points in the sequence (upwards, downward or sideways).
Step 4: The trader should identify the most important reference points (the most recent swing highs and swing lows) because a break of either one will be either a buying or selling opportunity for the trader.
Step 5: Wait until confirmation arrives. Do not try to guess at what point the trend will reverse; wait until the price breaks through the structure or changes the character of the trend. When you do this, your trading will be reactive to what you see happening in the price and not based on predictions.
Step 6: Entry Points: Plan your entries on retracements. In a confirmed upward trend, it is common to wait for a pullback in price action to either the prior higher low or to a support area or trendline and then wait for confirmation that buyers are entering before entering long. The same approach applies to downtrends, except in reverse.
Setting Stops and Targets based on Structure: (Step 7)
A sound stop-loss for buyers is located just below the most recent low and for sellers, just above the most recent high since accessing that point structurally creates no more validity in continuing the trade. The targets are generally chosen by looking at the next key area of structure; for instance a previous high, area of resistance, or a measured move based on the greatest recent swing.
S. Structure Mapping vs. I. Indicator Based Trading.
Indicators are provides from price activity (e.g., Moving Averages, MACD, RSI) so they are a delayed, smoothed response to what the price has done, whereas Structure mapping is a direct reflection of price action so there is little or no lag. Structure mapping isn’t really designed as a permanent replacement for indicators; many traders use both (Using Structure for trend ‘Context’ and then adding momentum divergence (using an oscillator) at a Key Structure Level for ‘Confirmation’).
Mistakes Often Made When Mapping Structures
Over-labelling noise: Over-labelling of movement means that all small movements are considered as significant swing points and this causes the chart to be confused and signals to be wrongly generated. Draw the structures at the correct time scale according to the time frame that you will trade.
No consideration of higher timeframes: A good example of using a 5-minute chart and not considering the daily trend makes you trade against the primary trend.
Being mistaken in identifying the CHoCH as the sign of total reversal. At CHoCH will only give you the probable possibility that the direction could be reversed; it will not give the full confirmation that the direction will reverse. In many cases, the CHoCH also fails, and when it does, the market continues in the original direction. Therefore, again Conservative traders must wait for confirmation in the new direction, through a complete Break of Structure (BOS), before they take the trades in the new direction.
static support and resistance = Levels versus Zones
A static price point. The ascending and descending neckline is a location within the swing trade that restricts your possibilities to exit a swing trade. If you exit a trade you risk missing out on profits when the next swing trade comes through. Many traders lose profits in a swing trade due to a low neckline.
subjective with no rules
Different traders find different levels of what they can call the high swing level. For example, if a trader finds an area where he believes to be the high swing level, then the opposite trader finds a completely different area as their high swing level, causing confusion! Many traders make incorrect assumptions when it comes to determining high swing levels. This is due to not defining what a level of a high swing is.
structure mapping Simple practical example
Just imagine a Stock Price rose from Rs500 (Swing Low) to Rs560 (Swing High) then went back down to Rs530 (swing low); then it went up again from Rs530 to Rs590 (Swing High) and then dropped down from 590 to 555 (A Swing Low). The structure is now very clearly bullish with the swing high being 590 with the swing low being 555. For example a trader who uses structure mapping would essentially look to buy trades near the 555 area with a stop loss just below the 555 area (Lets Say 548). Their targets would either be near the next resistance level or in a measured move projection above 590. Now if the price dropped below the previous swing low of 530 without making another new high that would indicate a change of character, meaning it may not be going up anymore. Before opening new trades, traders would need to be very careful and possibly lower their exposure to avoid losses.
Conclusion
So basically, structure mapping provides a way to objectively view the market but is not a specific tool. Once swing highs and lows have been identified, along with breaks in structure and changes in characters appearing early, you can create an objective and repeatable process for evaluating trend direction and making entries/exits while also managing your risk. Structure mapping takes much of the noise and subjectivity out of a discretionary process by eliminating the “the stock is bullish” type thinking and replacing it with a system that “the stock has made a higher high and higher low which confirms an uptrend structurally.” The method of structure mapping is an extremely important skill for traders to possess when interpreting stock price movements regardless of whether they are trading over the long or short-term. Because it doesn’t go out of style like other technical indicators, structure mapping basically provides a disciplined approach to interpreting the message t