Liquidity

Introduction
Liquidity is a fundamental yet highly misunderstood concept in terms of stock trading. Many traders view liquidity as the ability to transact a stock in a simple manner at a certain price. However, within the context of SMC and institutional price action trading, liquidity represents a much more complex idea. Essentially, there are pools of open and pending orders (stop-losses, take-profits, breakout entries) that collect at certain price levels and serve as the “fuel” for large institutional participants to place their trades. in order to correctly read Market Structure (the way price is constructed within the market) and forecast price movement properly, it is critical that traders understand both traditional liquidity and price-action based liquidity.
This document discusses two ways of looking at stock market liquidity: traditional and the concept of liquidity pools from an institutional perspective, as well as how traders incorporate and use both definitions of liquidity in actual trading strategies.
Classic Definition of Liquidity
Liquidity is defined in traditional terms as the time required to buy and/or sell an asset (stock) without causing a substantial price change. An example of a very liquid stock is usually large-cap stocks traded on major exchanges. Liquidity is defined by:
A lot of volume: Many shares trade every day so it’s easy to buy or sell anytime.
Low spreads: The cost to buy vs. sell a stock is close (small) so costs to make trades are low.
Little price impact: If you buy a large number of shares you won’t push the price of that stock up or down.
On the opposite end you have an illiquid stock (usually a small-cap business or a thinly traded stock) where bid-ask spreads are wide and the volume of trades is low with large swings in price for relatively small orders. Liquidity has long been defined in this manner for all market participants (i.e., traders) because of the cost and effectiveness of executing trades especially when TD deals with large amounts of stock.
SMC and institutional trading theory (Includes SMC & Institution) narrows down the concept of liquidity to more specific areas on the chart (the price point at which many pending orders are concentrated as a cluster). These are;
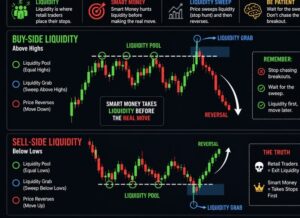
•Buy-side liquidity exists above recent swing highs where short sellers have placed stop losses (buy orders to close their short positions) or where breakout traders have placed buy-stop orders to enter long positions.
Sell-side liquidity: This is located under new swing lows because it is where traders who are long have placed stop-loss orders (sell orders to exit their positions), as well as where breakout traders have sold short (using sell stop orders).
The core idea is that major institutions will look for liquidity areas to fill their large orders because they need a substantial amount of volume to fill those orders. They often do so by moving the price slightly beyond a recent high or low point, which causes a number of other traders’ stops and limits to be triggered, therefore allowing the institutions to fill their large orders, typically before reversing the price back in the other direction.
Why Liquidity Matters when It Comes to Institutions
As previously discussed when looking at both Order Blocks and Fair Value Gaps, Large institutions are not able to place large orders without severely impacting the price in an unfavorable manner. For that reason, when these entities want to accumulate or distribute large amounts of stock over large blocks of time, they often rely on finding areas of concentrated liquidity to absorb their large order flow and to execute their trades efficiently and thus build or exit from their position(s).
One example is that when hedge funds buy big, they need lots of sellers so they can get buy orders without making the price go up crazy fast by buying too much. A way to do that is to create a quick drop below the most recent swing low so other longs hit their stop losses and gives new shorts their stop to enter the market. It creates a lot of sell orders for a short period, so the big player can take their longs at a pretty good price before the market reverse and goes up.
Sometimes, this process occurs as a “liquidity sweep”, a “liquidity grab”, or a “stop hunt” by the trading communities.
Types of Liquidity Zones:
1) Buy-Side Liquidity (BSL):

Short sellers’ stop-losses accumulate in this zone along with the Pending Orders of breakout buyers. Price spikes temporarily above these highs before dropping back lower again, which are called liquidity sweeps to the upside.
2) Sell-Side Liquidity (SSL):

Located under major swing lows or levels of support, this is where the concentration of stop-losses from long traders and pending orders from breakout sellers can be found. Prices tend to drop beneath these lows for a short period before turning back up, which is referred to as a Liquidity sweep to the downside.”
3. Equal Highs and Equal Lows:

A stock that produces a number of highs or lows at about the same price level results in an obvious, easily identifiable area where many traders are likely to place stop-loss orders or breakout orders. The equal high and low prices are generally considered as prime liquidity targets because of the predictability of trader behaviour at these levels, making them attractive for institutional liquidity grabs.
4.Internal Liquidity and External Liquidity :

Some traders draw a difference between internal liquidity, which exists inside the trading range (e.g., small swing points), and external liquidity at the edge of the trading range or the trend ( e.g., big highs or lows) External liquidity sweeps are generally considered to be much more important events, because after that a big directional movement is seen.
How Liquidity Zones are Identified and Used Mark the Latest Swing Highs and Lows: These are the most clear locations of where liquidity sits.
Find out the high/or low points equal to trendline liquidity
Multiple touch points at a certain order are at an even price: or Higher Lows/Lower Highs create trendlines, and these two types of systems frequently create liquidity.
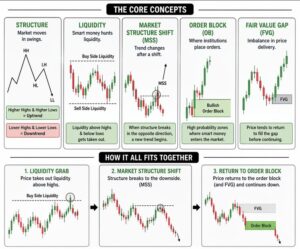
Combining Order Blocks and Fair Value Gaps: A majority of traders are usually waiting to see the price complete a Liquidity Sweep and to then be followed very quickly by either an Order Block or a Fair Value Gap since many traders believe that the confluence of the two will point to a likely reversal.
Confirm the shift in market structure: Once the liquidity sweep has happened, most of the traders wait to see the price structure being broken (example, Lower Highs, Higher Highs) as a sign that the reversal has begun before placing a trade.
Better timing of trades: By identifying liquidity zones, traders can avoid placing stops in obvious and vulnerable areas, and can instead place them in more strategic locations.
Reversals with a Higher Probability than Others: Combinations of shifts in market structure, price levels, or momentum (liquidity sweeps) often create conditions that are much more likely to reverse than those created by price action alone.
A push through the certain level of support or resistance (with most often a wick) and being reversed back in the opposite direction fast is a good sign that the liquidity in that area has been taken, and the price will probably reverse in the opposite direction.
Developing a Trading Strategy Utilizing Liquidity :
An example approach using liquidity is as follows: A stock is approaching a Swing Low with clearly established equal lows, which indicates that sell side liquidity is concentrated in that area. When the stock moves below the Swing Low and triggers many stop losses (liquidity sweep), it immediately reverses and moves upwards through a minor structure. The trader will then look for an entry point close to a Fair Value Gap or Order Block created during the reversal, place a stop just below the swing low of the liquidity sweep, and set a profit target at the next significant high as a buy side liquidity level.
This method basically gives you the chance to put your trades in the same places that financial institutions supposedly target, which means you will essentially trade with the ‘smart money’ instead of being caught on the opposite end of a stop hunt.
Liquidity and Market Structure:
The concept of liquidity as it relates to the uptrend of the market is generally accounted for and analysed through the structure of the market. In an uptrend, the price creates a series of higher highs and higher lows. In such instances, the sell-side liquidity levels, which are available below the most recent levels of higher lows, are most likely to be taken out expeditiously prior to a move back up again. Further to this point, in an uptrend, the buy-side liquidity levels which reside above the most recent levels of higher highs, also have the potential to be swept out prior to the occurrence of a deeper correction, or in some instances, a trend reversal. By knowing where the true liquidity pools are that will most likely become targeted positions based on the overall direction and structure of the trend, a trader will avoid creating a position in an area most likely to become the subject of a Stop Hunt and will instead position themselves to receive the benefit of the subsequent/effective move.
Benefits of Knowing Liquidity:
Improved Risk/Reward Setups: Waiting for the Annexation to be completed before entering (liquidity grab) generally allows for setting tighter stops and better risk/reward setups.
General Application: The concepts of liquidity are not limited to the stock market but apply to virtually all financial markets (e.g., stocks, forex, commodities, indices, and cryptocurrencies). When a trader understands how to utilize the framework of liquidity, he will find it broadly applicable across most markets.
Constraints and Criticisms:
.It’s very hard to determine whether a price change was an intentional liquidity grab by an institution or whether it was just a normal trade.
There is a tendency of traders to look at trades after the event and think that they could have seen the trade set up before it was made.
Fake signals: Occasionally, the price keeps going in the breakout direction, resulting in losses for traders who were expecting a “sweep and reverse” after breaking past a certain high or low.
Requires strong risk management: Because of the nature of most liquidity-based trading strategies where you are looking to get into them at or near the reversal of major key levels, the only way you can protect yourself from the inherent randomness of these trades is to have a good stop loss and proper position sizing. ‘
Conclusion
Liquidity in the general sense refers to how easily an asset can be traded for its value, but it also has a special definition in Smart Money Concepts as liquidation zones (areas of pending orders that the institutional traders often target). By learning to identify Buy-side and Sell-Side Liquidity Zones, Understand Equal Highs and Equal Lows, and Spot a Liquidity Sweep, Traders can learn more about why prices move the way they do and make better decisions about when and where to enter trades, and reduce their risk. As with all trading concepts, liquidity analysis should be combined with a trader’s market structure knowledge, Strict Risk Rules, and. Sensible Expectations of what might happen, and used with entire other analysis types, as it will not be a Sure Trade Proposition as a stand-alone indicator of