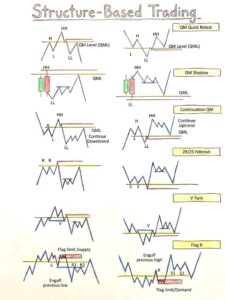
Candlestick Charts: 7 Critical Mistakes
What is a Candlestick?
Candlestick charts are an extremely robust tool in the area of technical analysis and probably the most frequently used charting option available to traders. They originated from the rice markets of Japan in the 18th century, where a man by the name of Munehisa Homma developed them as a way to keep track of both price and daily momentum. Today, candlestick charts are used by all types of traders (in Forex, Stock, Crypto, and Commodities Trading) based on their patterns. Here is everything you need to know about candlestick charts.
Candlestick Charts
The candlestick chart shows the price movement of an asset over a specified time frame, which can be any time frame from one minute to a day, hour, or week. The candlestick, as an entire thing, tells you who won that battle in between the bulls and the bears during the period indicated by the particular candle.
Candlestick Charts
There are four key points of data on any single candlestick:
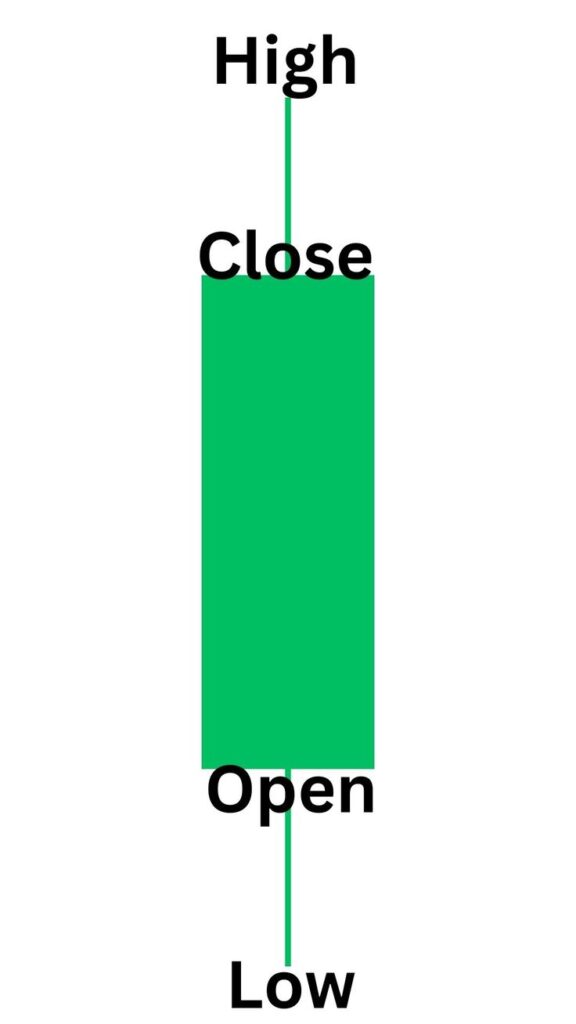
Open: This is the price that the asset began trading at during this period.
Close: It is the price that an asset ended its trade in this period.
High: The highest value achieved during the period.
Low: The lowest value achieved during the period.
The thick part of the candlestick’s body describes the overall value movement between open and close. The thin lines, or wicks or shadows, show where the candle reached its highest and lowest points. If the closing value is higher than the opening value, then the candle appears green or “bullish”. Conversely, if the closing price is lower than that of the opening value, then the candle will appear red or “bearish”.
Candlestick Charts
Candlesticks are Important to the Trader!
With candlestick charts, you can provide traders with much more information than you would normally get from a line chart. Rather than just being able to see where price finished, you can also see how big the move was, where it originated from and the severity of the buy and/or sell pressure. For example, having a long wick on a candlestick element is basically an indication that the price of the asset moved a large distance in one direction before buyers and/or sellers pushed back against that move (rejection).
When we look at candlestick patterns within the entire context that includes the trend itself, the support resistance levels, and also the volume that is being traded, they will provide very strong signals for when to enter or exit a position.
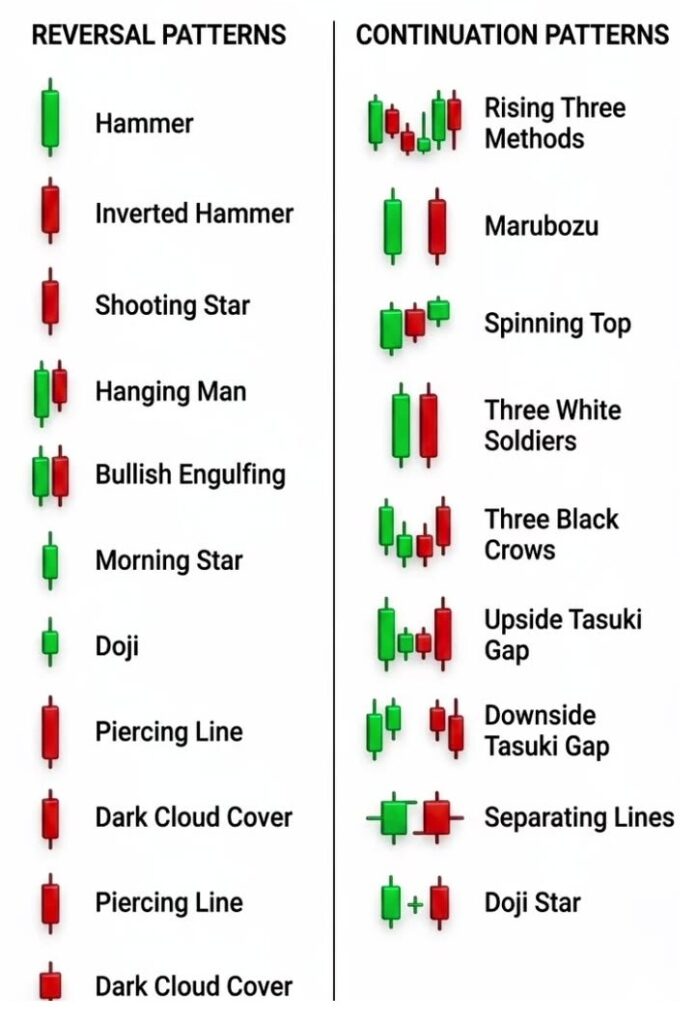
Single Candlestick Patterns:
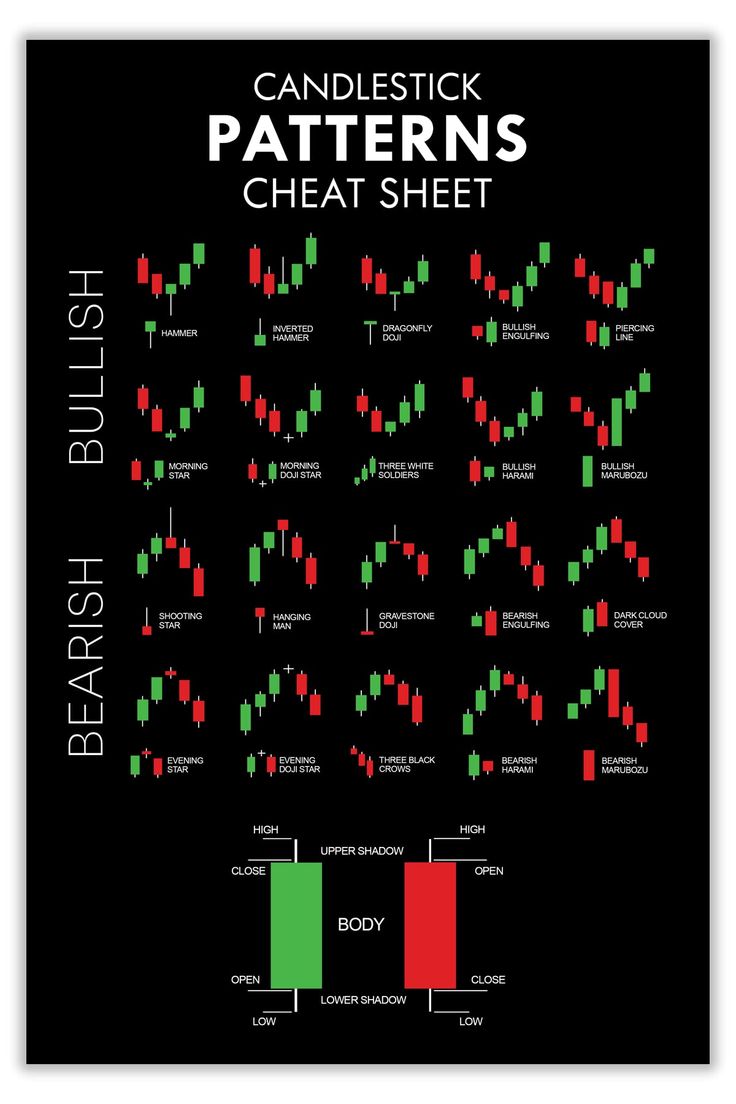
1.Dojis:
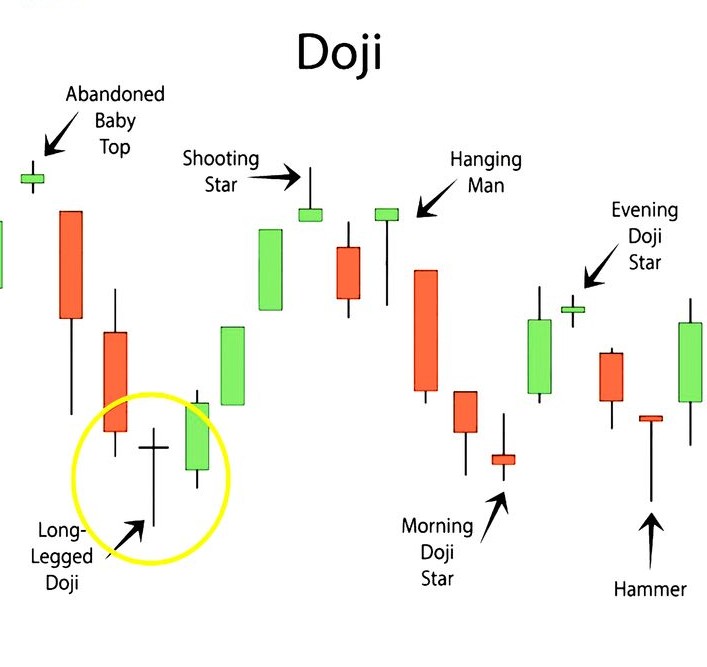
A Doji has almost no body at all (the opening price is extremely close to the closing price) according to Doji candlesticks, and there are wicks/shadows at the top and bottom. This means there is an indecisive market – neither the bulls nor the bears are in charge. Many times after a long strong trend, a Doji represents a reversal pattern.
Candlestick Charts
2. Hammer:
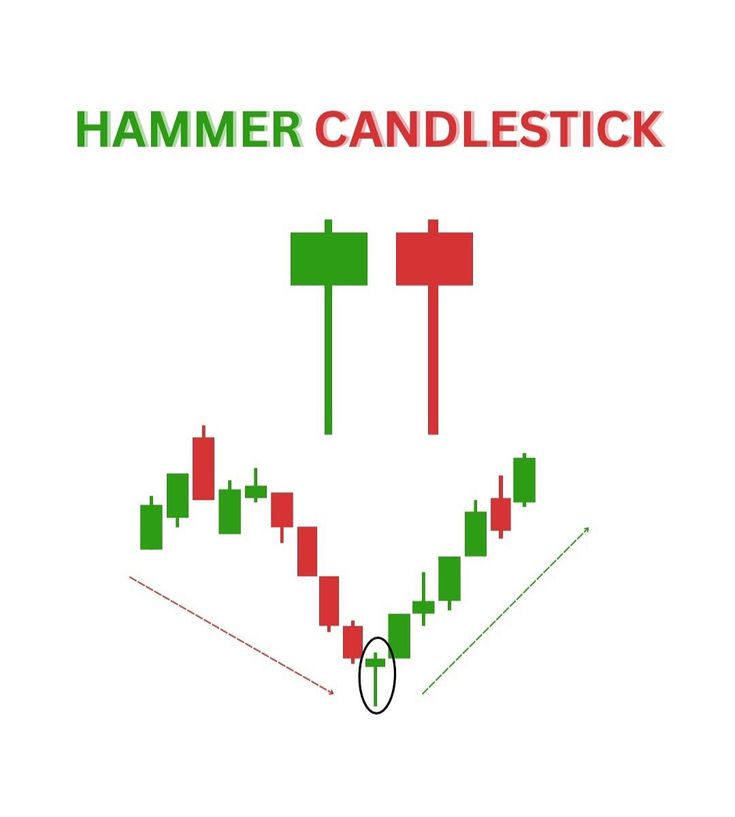
A Hammer shows up in a downtrend. The body is small and at the top, with a long lower shadow that’s at least 2X the length of the candle body. That basically tells you that sellers have pushed the price down quite a bit, but then the buyers jumped in, and the price was pushed back up. Therefore, this is a bullish reversal signal.
Similar to the Hammer but flipped, it comprises a shorter candle at the base with the long upper shadow. It develops during a downtrend and shows that buyers were making efforts to raise the price. And when it is verified by the following candle, it may be considered as a signal for the potential bull reversal.
Candlestick Charts
3. Inverted Hammer:
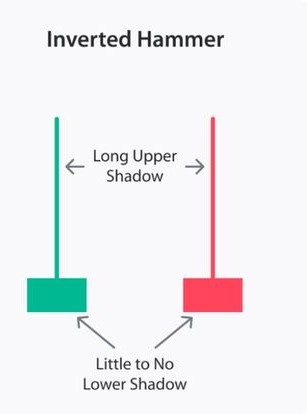
This candlestick has a long wick like the hammer but with a different orientation – the body is near the bottom while the wick forms the top part of the candlestick. This indicates buyers were able to drive the price higher during a downtrend. The candle following the inverted hammer should be used to validate this will turn into a bullish reversal candle.
4.The Shooting Star :
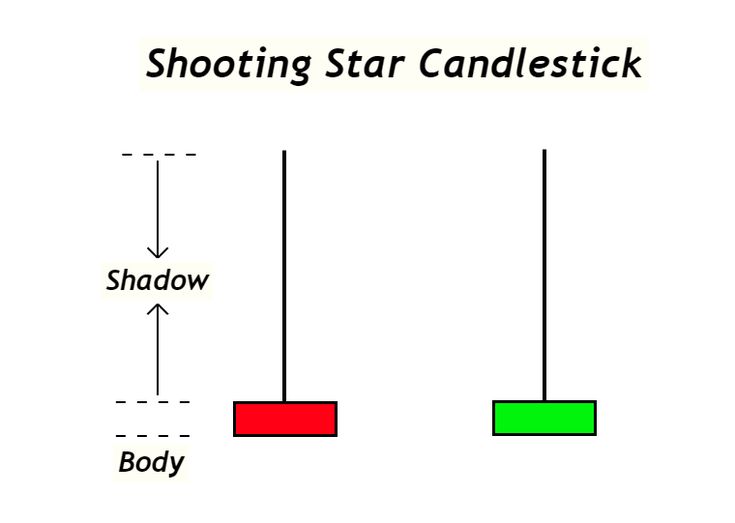
The Shooting Star is basically the bearish opposite to the Inverted Hammer. The formation occurs during an uptrend, and has a bearish candlestick with a small body near the bottom and a long upper wick. The price was pushed higher by buyers and then lower by sellers, and it provides a “bearish reversal signal”.
Candlestick Charts
5. Marubozu:
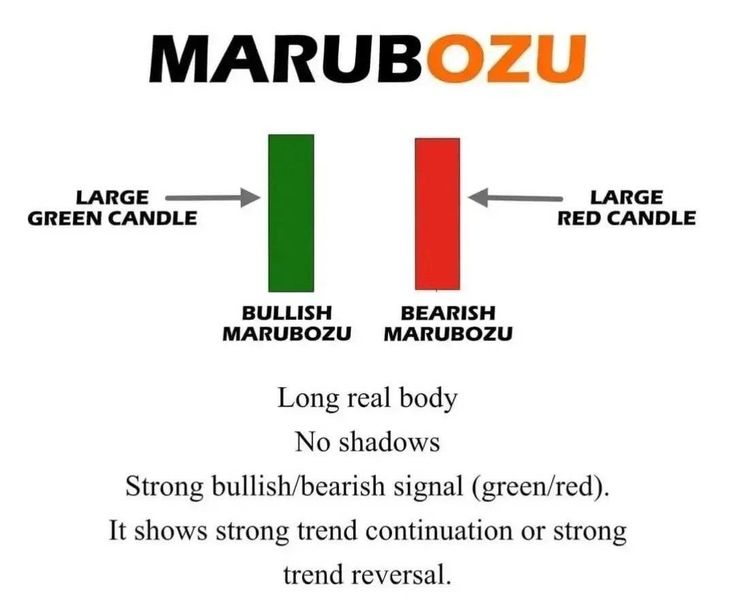
The Marubozu candlestick is full bodied without any wick. The Bullish Marubozu opened at the low and closed at the high, indicating extreme buying interest. Bearish Marubozu indicates complete selling pressure. Both indicate extreme momentum.
Multi-Candlestick Patterns
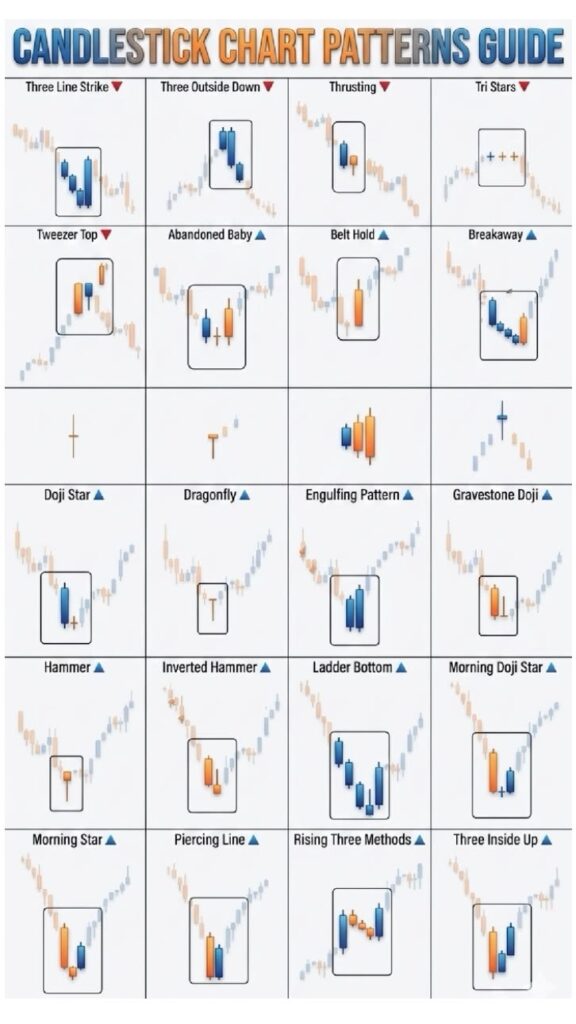
1.Engulfing Pattern:
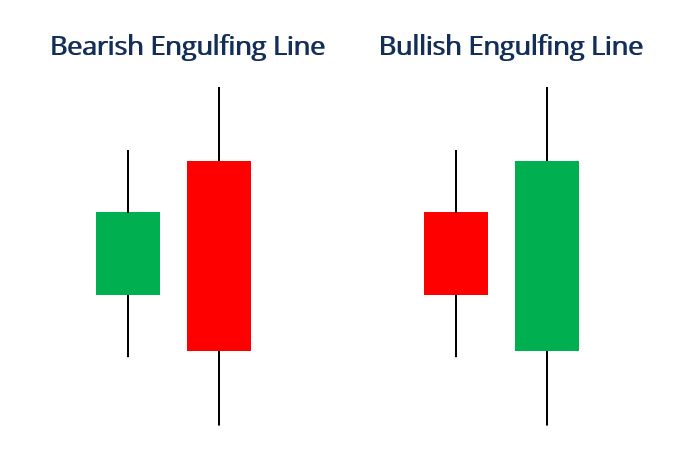
The Bullish Engulfing is a scenario where a smaller bearish candle is followed by a bigger bullish one that engulfs the previous bearish candle. It is usually viewed as a change of direction from selling pressure to buying pressure and is basically the indicator of the start of an upward move.
The Bearish Engulfing pattern, however, is exactly opposite to the Bullish Engulfing pattern. It is observed when a small bullish candle is followed by a large bearish candle, which fully engulfs the earlier candle. It is a clear indication that the sellers have taken control of the market and the price will probably go down from that point.
2.The Morning Star Pattern:
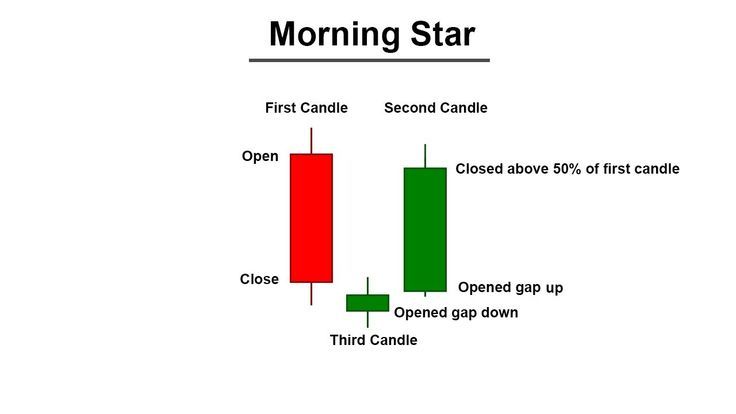
This Pattern has three candles and suggests that prices may start increasing soon. It has three elements:
A long, dark, downward Candle.
A Candle with a smaller Body (called the “Star”), which could be either up or down.
A large up Candle whose closing price is above the Body of the large down Candle.
This particular pattern demonstrates a slow change in the direction of momentum from Sellers to Buyers.
Candlestick Charts
3.Evening star:
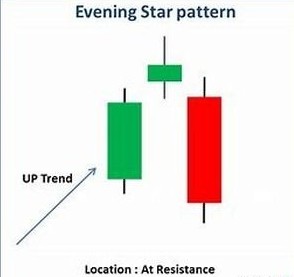
This is the bearish counterpart to the Morning Star. Three candlesticks indicate a shift in control from buyers to sellers – the buyers are losing control, and a downtrend is beginning. The three candlesticks are a large bullish candlestick, a small star, and a large bearish candlestick.
Candlestick Charts
4) Three White Soldiers:
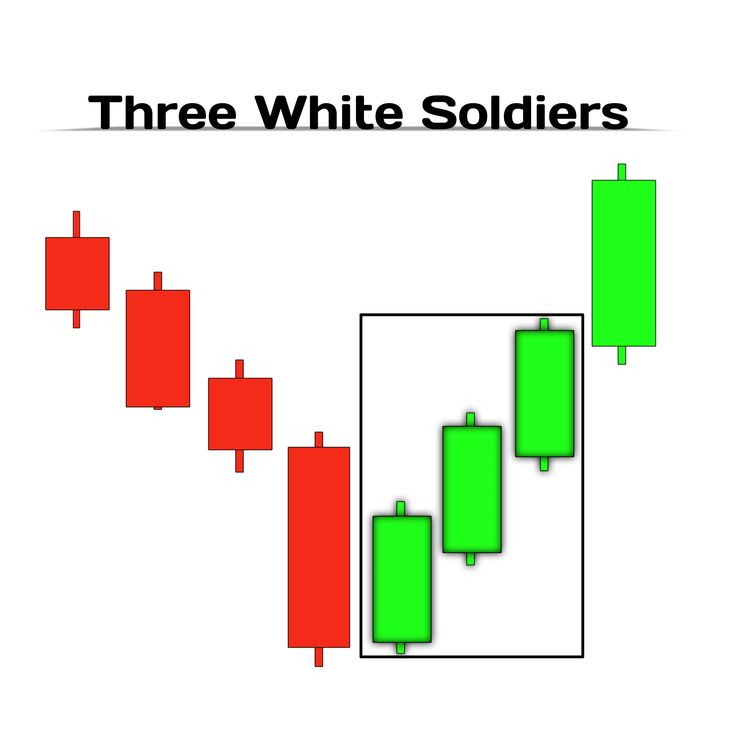
Three consecutive long bullish candles, that each have an opening price that falls within the body of the candle prior to it, and a closing price that continues to rise higher. This is a strong bullish continuance signal, or reversal signal, as the bulls demonstrate consistent buying strength across multiple trading sessions.
Candlestick Charts
5) The Three Black Crows:
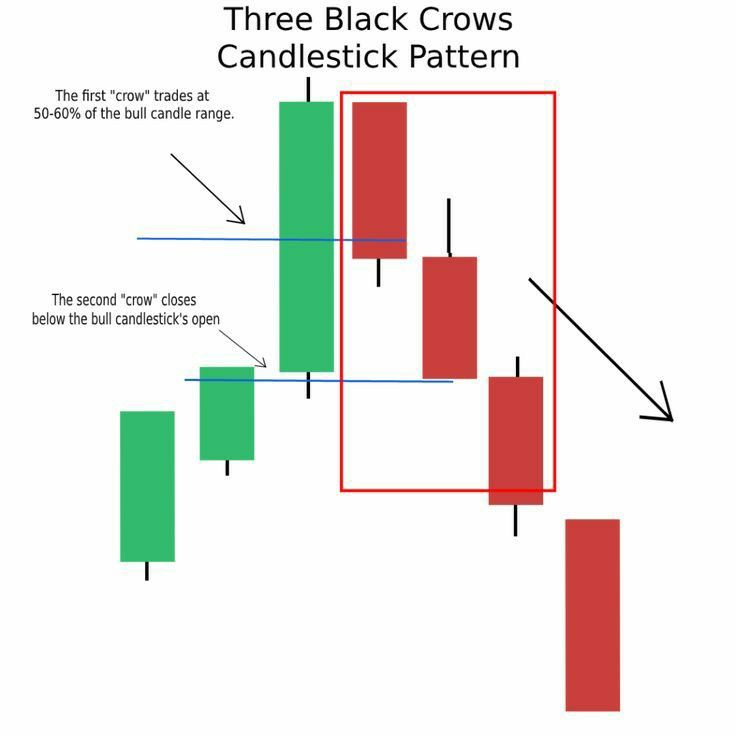
A bearish “Three Black Crows” pattern or Three White Soldiers pattern which has three successive long bearish candlesticks with lower lows. The Three Black Crows pattern basically shows a strong selling force with continual volume which usually initiates a large downtrend or downward trend.
Candlestick Charts
6) Harami:
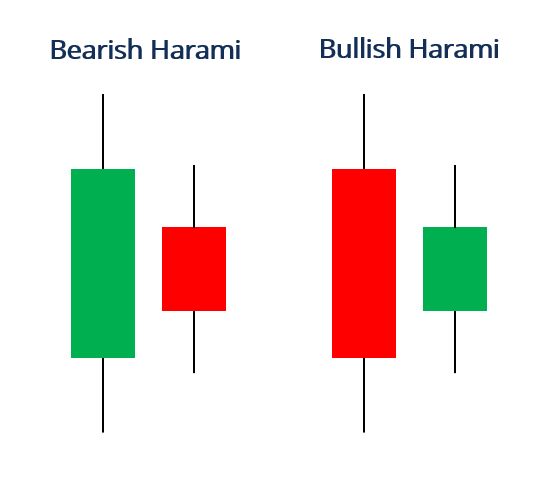
The “harami” refers to a binary candlestick pattern, where the smaller candle’s range fits within the larger candle’s body. The appearance of a bullish harami in a downward trend will suggest that the selling pressure is weakening, and the appearance of a bearish harami in an upward trend will suggest that the buy side pressure may be diminishing.
7) Tweezer Tops & Bottoms:
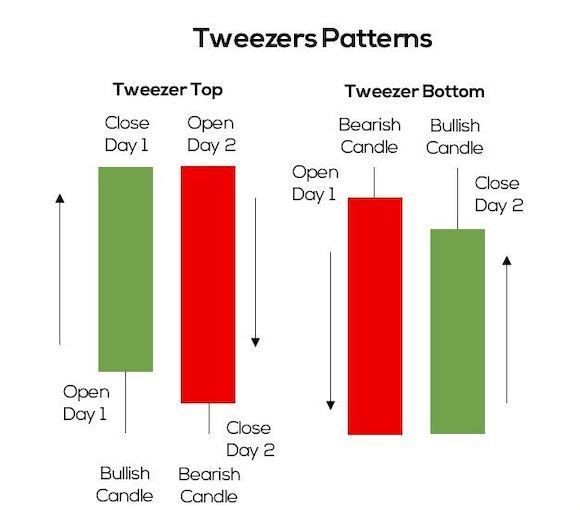
The Tweezer Top develops when you see two candlesticks which both make the exact same high at resistance (one bullish & one bearish) as a possible indication to look for price to start moving lower.Tweezer Bottoms create a possibility for price to start moving higher by displaying matching low prices as supports.
Candlestick Charts
How to Use Candlestick Patterns:
Study with trends the Most reliable Candlestick Patterns Occur When They Are In Agreement With The General Trend. For Example, A Bullish Reversal Pattern That Develops At An Important Support Level Within An Overall Uptrend Will Be Much More Bearish Than A Bullish Reversal Pattern That Develops At An Important Support Level In A General Uptrend.Therefore, Before Using Any Candlestick Pattern, You Should Ask Yourself: Is This Pattern Occurring In The Direction Of The Trend Or Against The Trend? Use The Support and resistance levels to determine the strength of the trend.
A hammer appears randomly on a chart as it has no meaning.Hammers at support levels that have stopped price before multiple times can therefore provide high probability entry signals.In all candlestick pattern type analyses, always make sure you have identified the price level in which you are using it. 1 / 3 An example includes: buying at support with a bullish engulfing candle, an RSI reading in oversold condition, high volume etc., which means there is strong confluence between all of these signals, making it a good place to enter a buy position.The more signals provide indication of one direction the higher probability your trade will succeed.
Candlestick Charts
Conclusion
The timeframe is important High timeframe (daily/weekly) candlestick patterns have more significance than lower timeframe (1-minute/5-minute) candlestick patterns.For example, if you see a reversal candlestick pattern on the daily chart, it reflects the collective opinions of thousands of traders around the globe; a pattern on the 1-min chart could have been formed by a single large order. Mistakes commonly made by Traders One of the most common mistakes is trading a pattern in isolation.A Doji in the middle of a trend, with no support or resistance in sight is simply noise.Context is key. Another mistake, is ignoring the trend.
In a very strong rising market, looking for a downturn is like swimming against the current.Trade with the trend unless you have overwhelming evidence for a downturn. When you do not wait for confirmation, that will result in you entering too soon.A Hammer can dlestick will be formed: how exciting!But do yourself justice and wait for the next candle to appear which confirms the buying pressure.Many reversals fail on the first signal. Being over-reliant on candlesticks without taking into account the underlying conditions of the economy, the news of the market, and the general macroeconomic conditions can result in the loss of money.
Candlestick Charts
Candlesticks are simply one of many tools in your toolbox for trading, and therefore, you should always use them as part of an overall trading strategy rather than let them be your “crystal ball.” Creating a Candlestick Strategy Here is a very simple strategy that is very effective: 1. Using a moving average like a 50-period EMA or a 200-period EMA, determine whether the trend is up or down 2.
Identify the key support/resistance levels on your chart 3. Be patient and let one of those levels show a signal from a candlestick 4. Confirm entry to your trade using an indicator such as RSI, MACD, or Volume 5. Once you have entered into the trade, set your stop-loss just past the end of the wick of the candle by which you entered into the trade. 2 / 3 Aim for the next important level or try for a risk-reward ratio of at least 1:2.
Watch Full Information