Fair Value Gaps
Introduction
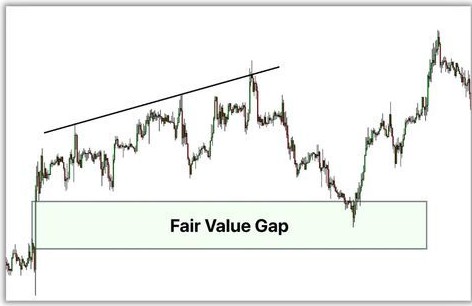
Smart Money Concepts” (SMC) and the principles of institutional price action trading, the “Fair Value Gap” (FVG) has become one of the main tools traders are using in their attempt to track the movements of larger market participants. A Fair Value Gap can be defined as an area of price inefficiency within the price action, where there was such a large move in one direction that there was an obvious imbalance left behind between buyers and sellers. As a result, traders will look for this area of price imbalance to anticipate where price may return to “rebalance” and continue in its original direction once again. Therefore, Fair Value Gaps have become a popular addition to most trade entry/exit and risk management techniques.
The purpose of this paper is to explain what a fair value gap is, how and why they occur, how to identify a fair value gap, and ways that a fair value gap can be used in actual stock trading.
Fair Value Gaps: What Are They?
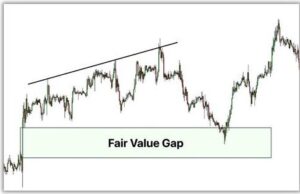
A Fair Value Gap occurs in the form of a three-candle pattern when there is a large mismatch between buying pressure and selling pressure to the extent that the price bypasses a segment of the chart because hardly any trading happened around that segment. Three candles in a row can be used to identify a Fair Value gap, because the wick of the first and third candles don’t cross each other. So, there will be a visible gap between the wicks. The second candle is usually a very strong, large-bodied candle that had created the mismatch.
In the case of a bullish fair value gap, it would occur when the high of the first candlestick is lower than the low of the third candlestick. The gap is basically comprised of the area or the space between each of these two points. Conversely, a bearish fair value gap occurs when the low of the first candlestick is greater than the high of the third candlestick, and the gap is produced in the opposite direction.
The understanding of this concept comes from a theory that believes that Oil Markets are looking for a “Fair Value”, which is essentially a price range where there is an equal number of buyers and sellers. Also, according to this theory, if a Fair Value Gap occurs, then prices were probably driven away from the Fair Value too fast, and the oil market will ultimately revert to the Fair Value or continue the existing trend.
What Creates Fair Value Gaps?
Fair value gaps are usually developed because of high amounts of either buying or selling pressure such as institutional order flow, significant news events, earnings reports and economic releases. When there’s a lot of orders at once on the market, there won’t be enough orders to offset all the prices, so the price will go up or down through certain price ranges with practically no trades.
Because of this quick move, an inefficient spot remains since most of the price levels in that area didn’t see adequate two-sided trading. Generally speaking, there’s a natural tendency for the market to come back and re-visit these zones of inefficiency again and again in the future because of unfilled orders and or unbalanced supply/demand that’ll pull/drag price back towards a more “fair” equilibrium a balance of sorts before the large overall trend continues.
Bullish Fair Value Gap:
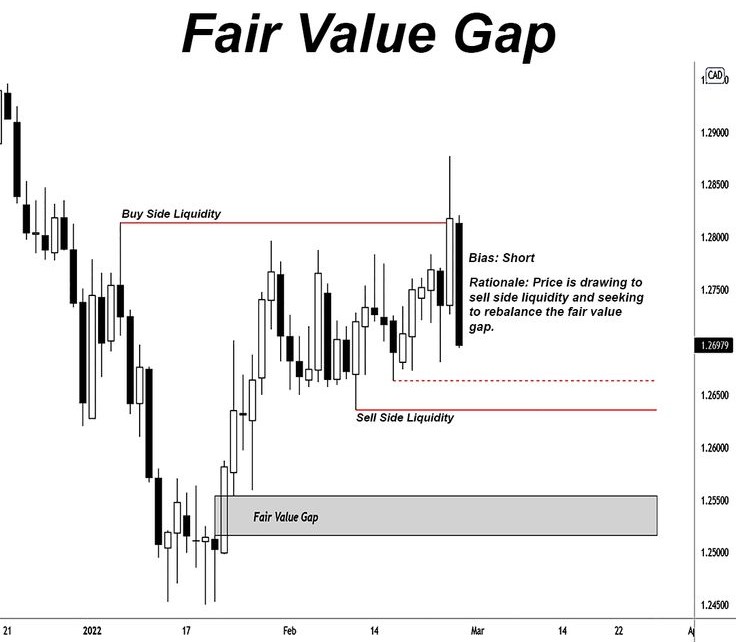
The fair value gap arising from a strong upward move forms. The two boundaries of this gap are defined by the high of the candle before the impulsive move and the low of the candle after the impulsive move. Normally, traders look at this region as a potential support zone; thus, if price retraces back into the gap and continues to progress higher, traders believe that buying interest will resume and continue to take the price higher.
Bearish Fair Value Gap:
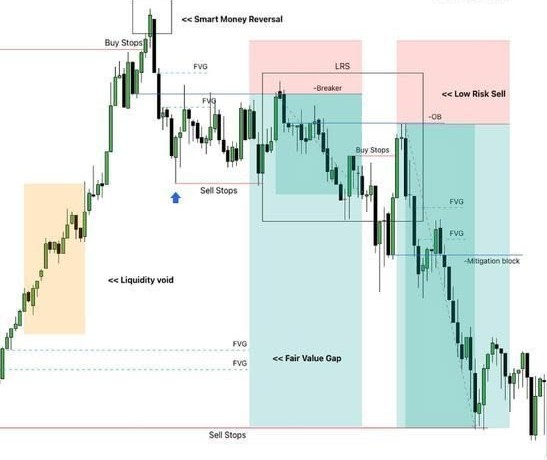
This appears when there’s a big downward movement. The gap is seen as the area between the lowest point of the candle that happened before the big move and the highest point of the candle that happened after the big move. The area in between those two points is a general resistance area; meaning if the price comes back up to that area, sellers could jump back into the marketplace.
Finding a Fair value Gap visually on a chart:
The Fair value gap is probably one of the more mechanical ways to look at price action:
Find a strong and impulsive candle. A large bodied candle which represents a big change in price and is often because of a breakout or a major news event.
Find out if the candle before and the candle after the impulsive candle has left a “gap” (no overlap between the wicks of the two candles).
Find the gap. The area between the two wicks is the Fair Value Gap.
Monitor retracement – the majority of traders are waiting for the price to retrace back into this region as an entry zone which is congruent to the direction in which the impulsive move occurred.
Monitor for either partial or full fills – Because the price could reverse after attaining what could be termed as a 50% fill (which is the equilibrium of the gap) but in other cases, the price tends to fill the entire gap before it can continue to make a move.
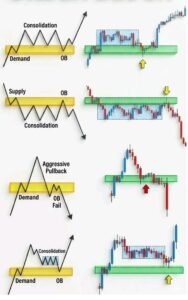
There is a massive distinction between an FVG and an order block.
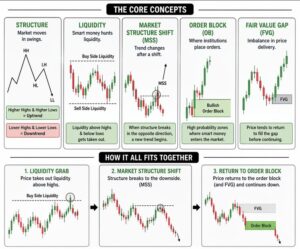
Fair value gaps and order blocks can be traded together as they are both essential components of Smart Money Concepts. however, they are not the same thing. An order block is the last opposite directional candle seen before a significant price change occurs and indicates the area of institutional buying/selling. A fair value gap is a price imbalance or inefficiency created by a significant price move.
When actually applying this concept, many traders will look for confluence between the two. So if you have a fair value gap that overlaps with an order block or is very close to an order block, that’s typically considered to be a “high probability” area that the price will react to. This is because not only does the area have the footprint of institutional orders, but it also has the footprint of inefficient price discovery.
Using Fair Value Gaps in trading agreements:
Most traders will use Fair Value Gaps along with many other items in their overall trading.
Analysis of trends and structures: It is necessary to identify whether the bulk of the market is in an uptrend or a downtrend or is ranging by observing swing highs and swing lows prior to seeking fair value gaps that correspond with the bias being produced by the market.
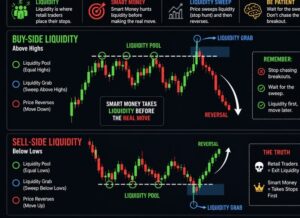
Liquidity: To identify potential area where as stop-loss order is cluster as price often sweep out liquidity prior to price reacting from a fair value gap.
Identifying The Entry Timing: The trader wait for the price to return into the fair value gap and will look for confirmation to enter the trade.
Stop-loss placement: Place the stop just above or below the fair value gap or the closest swing high or low, creating tight stop with define risk to each trade.
Profit targets: Take profits at major structure levels next to the entry, earlier highs or lows, or using a predetermined risk/reward (like 1:2, 1:3).
In a standard trading setup, the trader will find a stock that’s moving up (an uptrend). Next, they look for a Fair Value Gap (bullish) that was created during the recent rally. They then wait to see if the price pulls back (retraces) into the area where the gap was created (zone). When a buy signal (bullish reversal) is generated in the area of the gap, the trader places a buy order (long) and sets their stop loss just under the gap.
Multiple Timeframes in the Using of the Fair Value gaps:
Many traders use the fair value gap across multiple timeframes to add context to their trades. One technique that I see frequently is finding a fair value gap on a higher timeframe (ex, daily, 4 hour) as an overall zone of interest and then dropping to a lower timeframe (ex. 15min, 5min) to refine the actual entry point when the price is within that zone. The concept behind this top-down approach is to leverage the reliability of higher timeframe analysis and add the precision of lower timeframes to determine the actual entry point(s).
Benefits of Trading With Fair Value Gaps:
Mechanical and Objective: The definition of fair value gaps is usually made up of three candles and once traders understand this concept, they can consistently identify fair value gaps and have rules to trade off of. Other price action concepts may be more subjective in nature.
High Probability of Reaction Zone: Fair value gaps are inefficient so when price returns to them, there is a good chance that you will get a reaction from the market, it gives you a logical area to plan a trade based on.
Multiple uses in different markets – The idea works with stocks, indices, Forex, and Crypto and can be used on different timeframes based on your trading style.
Risk management usage – The boundaries of the FVG are well defined, so traders can set specific stop and entry levels when using FV than they would be able to without it. It also makes the trading plan more clear.
Limitations & Criticisms
While (FVG) Fair Value Gap concept is gaining in popularity, there are several limitations that exist with this concept.
Not every gap will be refilled: Many of the fair value gaps will at some point be retraced but it is not always the case that the price will return to the exact fair value gap particularly if trading in a very strong trend market.
There is no general agreement among academics on what constitutes a statistically valid trading edge when it comes to fair value gaps, therefore, many traders experience different results using different strategies.
The risk of over-dependence: Occasionally, certain traders may become overly dependent on fair value gaps and as a result, neglect to consider the general market conditions, fundamental analysis and various forms of risk management in making trade decisions.
Subjectivity in conjunction: Although the gap is objectively defined, the traders decide on which gaps to trade, how to combine these gaps with other trading tools, and how to trade around those gaps which still require a measure of discretion.
Conclusion
Traders can identify inefficient price areas to trade using fair value gap indicators to determine future trading interest areas. A trader’s knowledge of how fair value gaps are created assists with the identification of retracement levels to identify more precise entry and exit points, and apply a better level of risk management. Fair value gaps are also like any other technical analysis tool; they work best when trading in combination with a solid understanding of current market structure, proper risk controls, and realistic expectations regarding the limitations of the tool. If you are considering using fair value gaps in your trading, I recommend that you start by practicing on historical charts and backtest your method extensively before using it to trade live money.