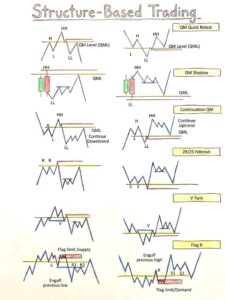
Order Blocks

{"remix_data":[],"remix_entry_point":"challenges","source_tags":["local"],"origin":"unknown","total_draw_time":0,"total_draw_actions":0,"layers_used":0,"brushes_used":0,"photos_added":0,"total_editor_actions":{},"tools_used":{"border":1,"transform":2},"is_sticker":false,"edited_since_last_sticker_save":true,"containsFTESticker":false}
Introduction:
In technical analysis, traders seek out tools that show where institutional investors, hedge funds, and large market players are entering or exiting positions (i.e., “smart money”). The order block concept has become very popular with the Smart Money Concepts (SMC) traders and the price action traders. Knowing how to use order blocks can help a trader determine where to enter and exit a trade, understand where large buyers are located, and develop better trading strategies that define where an order block could be reversed.
The point of this note is to give an explanation as to what an order block is; how they are created; how to locate them within a price chart, and to provide practical examples of how traders can utilise them when trading stocks.
An order block is basically the final bar or group of bars of opposite movement just before a major, dominant price movement occurs in the opposite direction. Put another way, an order block is a place on the chart where big players placed trades and caused the price to move dramatically in another direction (or continue moving strongly in the same direction).
here’s a quick example: let’s say a stock has been trading sideways for a while or slowly declining and then all of a sudden, there’s this massive green candle that shoots the price up. usually, the last red (bearish) candle right before that big green candle is called a “bullish order block.” the idea behind it is that institutions purchased a massive amount of stock at the price of the last red candle, then when their order was filled, the price took off.
A bearish order block means the market will go down soon after it. It represents the final bullish candle (the opposite of the bearish) prior to a major selling occurs in the same area as the order is placed.
What causes order blocks to develop?
Order blocks are relatable concepts to how institutional traders interact with financial markets. When a retail trader purchases or sells several hundred shares, order fulfilment does not affect price; however, institutional traders will need to fill orders that are often tens of millions of dollars (USD) in size. If they bought everything at one time, they would probably move prices against themselves, and would therefore have very low average buying prices.
In order to circumvent this, corporations divide up their order and progressively submit it to a predetermined range of prices, this generally being at a time of consolidation or a small retracement in price. The “accumulation” (or “distribution” in the case of selling) basically creates a footprint in the chart itself. Once they have bought enough, they can move the market significantly in the direction they want, and the order block will remain as evidence of where the organisation accumulated their order.
That is why Order Blocks tend to be observed at the Beginnings of Major price moves, because it is the area where there was a prior imbalance of supply and demand before the appearance of the breakout.
Order Blocks categorization
1. Bullish Order Block:

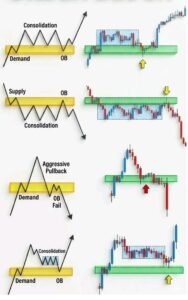
Bullish order blocks are formed before a bull price move occurs. This is the last bearish (down) candle seen by traders prior to the reversal of price and then an upward rally. Traders will see this as a support level, believing that once price returns back to this same area, then the buyers (the institutions) will come in again to buy into the market and thereby protect their positions.
2.Bearish Order Block:

A downward movement of price yields the formation of a bearish order block. It is the very last bullish candle created before the price direction shifts downward. The price generally reacts at this very particular area when the price pulls back to it as a resistance level for the sellers to re-enter the trade.
3. Breaker Blocks:

The term Breaker Block refers to a more advanced concept, where an Order Block has ‘broken’ (hence, the name). An Order Block is an area of supply or demand that has insufficient facts to determine whether or not it will hold/support price action. When a bullish Order Block has broken (failed to support price), it often acts as resistance; conversely, when a bearish Order Block has broken (failed to resist price), it often acts as support. This is similar to traditional technical analysis where old supports typically become new resistance and vice versa .
4.Mitigation block:

like breaker blocks, a mitigation block is an area in which the price returns to “mitigate” or balance out unfulfilled institutional orders, usually resulting in a reaction when the price touches this area.
Finding Order Blocks Using a Chart
The process of identifying order blocks generally involves;
While there are minor differences in the procedures used by traders to identify order blocks, there are general guidelines for the process of identifying an order block.
Find a strong impulsive movement. Candles or a sequence of candles with sharp movement in one direction are considered impulsive. Impulsive movement typically results in the breaking of a previous level of structure (swing high, swing low).
Look for the candle that is the opposite color of the candle that was impulsive.
Mark the high and low of the previous candle. That becomes your order block zone.
Wait for price to come back to the previous trading area – most of the traders wait for the breakout to occur and then wait for the price to come back into the order block because this area is considered as the high probability area for the entry.
Wait for the price to retest the zone; most trader will not trade the breakout itself but instead wait for price to come back into the order block (high probability entry).
Order Blocks Verses Traditional Support and Resistance
Order Blocks are areas where institutional buyers and sellers have made BIG commitments to the markets! Traditional support & resistance are usually horizontal lines where price has previously found support or resistance to that area.
Order Blocks are also areas of strong support or resistance where large buy/sell orders have been placed by large institutions and while Traditional Support and resistance levels have a horizontal nature, OrderBlocks will have more of a “box” shape.
Order blocks, as identified on a trading chart, will look similar to support and resistance areas on a chart. Support and resistance are typically identified on a chart with a horizontal line that connects several price points, while order blocks are based on a candle or group of candles that are associated with a major directional move. Therefore, an order block will typically have a much tighter focus than a support or resistance area will have and therefore are seen as more institutional in nature (i.e. less subjective). That being said, there is still some subjectivity involved in identifying an order block based on how a trader is interpreting the chart.
Trading Strategies Using Order Blocks
Often traders will use order blocks as part of a larger strategy, that includes:
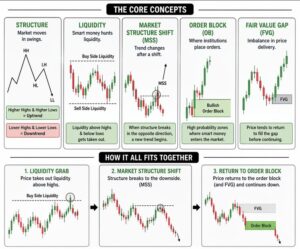
1. Market Structure: Finding out higher lows and higher highs for upward trends or lower highs and lower lows for downward trends is important to set the general direction before the trader looks for the order blocks on the trend line.
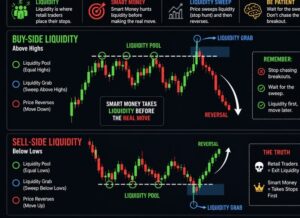
2. Liquidity Zones: These are the points where traders’ stop loss orders or pending orders (buy or sell orders) are most probably concentrated, for example, above the previous high price or below the previous low price. Price will normally sweep through these liquidity zones and then reverse from the liquidity order block.
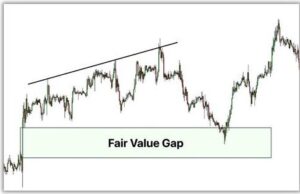
3.Fair value gaps (imbalances): When there is very strong buying or selling activity, it creates gaps in the price where the price moved through certain levels without any trading. These create what we refer to as Fair Value Gaps and will often be found in close proximity to Order Blocks so they can be used as additional confirmation when making your trades.
4.Risk Management: Risk management includes putting a stop loss order on the opposite side of the order block zone that you went long on (e.g. underneath the low of a bullish order block), and then selecting a take profit goal based on either the next key resistance level, or attaining an appropriate risk: reward ratio (Often 1:2 or better).
A common trade setup could be: the trader sees an uptrend in the stock as a whole, identifies a bullish order block in the most recent rally, waits for the price to come back down into that area, finds a bullish candle, buys long, and sets the stop loss just below the order block.
Advantages of Trading with Order Blocks :
Tighter Stop Loss – Since order blocks are specific areas and not wide support shows, most traders find it feasible to use small stop losses and therefore increase the risk to reward ratio.
Order blocks also provide alignment between retail and institutional activities. Aligning retail trading needs with the footprints of larger market players theoretically improves the chances of capturing big moves.
Order blocks can function in various different markets (stocks, forex, commodities, and crypto) and across almost all timeframes (from minute to weekly).
Limitations and Criticisms :
Popularity of order blocks comes with several limitations:
The order blocks are subjectively drawn by individual traders; no two traders will ever consistently get the same answer. In the absence of a universally accept algorithm to locate order block, there will never be consensus among trader.
Additionally, the theory behind order block assume that all order block are linked directly with institution yet cannot be confirm as such through the price data alone. Critics of the order block theory also maintain that order block trading is just another re-packaging of traditional support/resistance level etc.
Problem with Backtesting: Since it subjective how we identify order block, it tough to backtest an order block strategy in a totally systematic way, making it hard to proof-test long-term profitability.
False breakouts – There is a possibility that an order block may not work at all, especially in a low-liquidity or chaotic market conditions. If you do not apply proper risk management to your trades, you may be losing a lot of money.
Conclusion
The idea of order blocks has recently gained considerable traction among traders who are attempting to use Smart Money Concepts (SMC) and Price Action to trade. Order blocks provide traders with a very specific means of identifying the areas where Institutional Buyers/Seller (Smart Money) initiated their buying/selling pressure. Many traders using this concept of an order block use it to not only identify where to enter and exit a position, but also to properly set their stop loss based on this level of price movement.
Order blocks are not a magic wand. They work well with technical analysis and will do better if you use them alongside other tools to manage your risk properly and develop a solid trading plan. Once you have identified Order Blocks on historical charts and have tested your approach through backtesting, you should keep in mind the subjectivity of this technique when you actually start trading with real money.