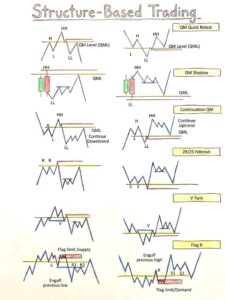
Support and Resistance in Technical Analysis
Introduction
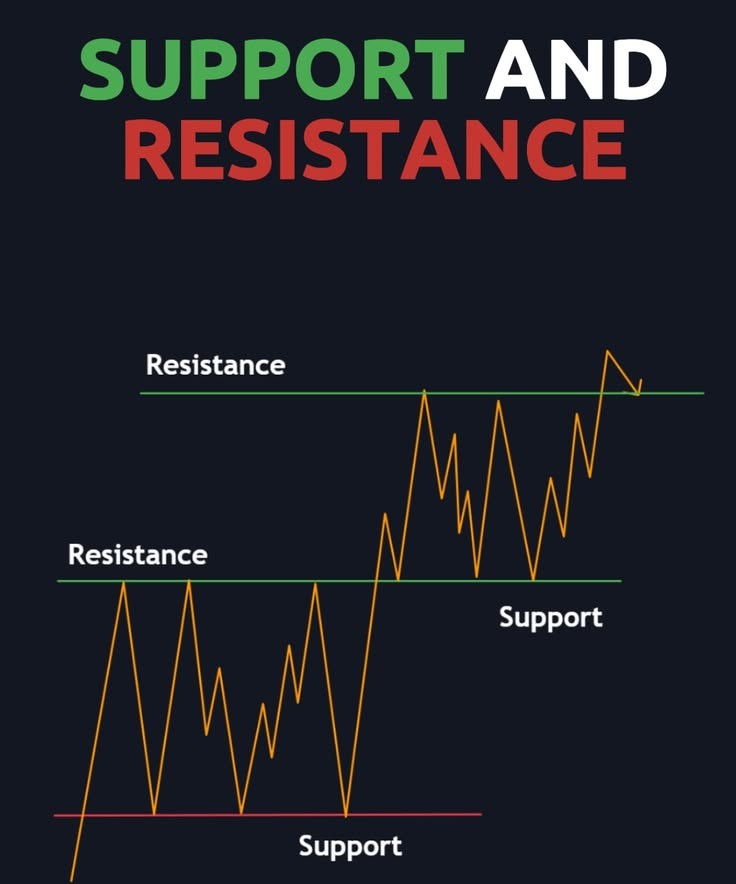
Support and resistance are the basic principles of technical analysis; they are basically the foundation through which traders analyze price charts for stocks, commodities, currencies, indices, etc. The basic definition of Support and Resistance is/are price points at which Supply and Demand will determine whether or not an asset will continue its current upward or downward trend. When a price is at Support, there is basically enough Buyer interest that will continue to push that price higher. When the price is at Resistance, the supply of Sellers outweighs the demand of Buyers, so it will basically not go any higher than that point. Once you have established your Support and Resistance levels, you can now make better decisions regarding your markets, including where to enter, where to exit, where to place your stop losses, and how to manage any risks moving forward.
Sure, it looks simple. Still, understanding price movement along with support/resistance psychology, finding all the different mechanisms for these levels, and knowing how to use them in trade in actual everyday conditions are what are required to become a master of support/resistance. In this paper, I will present the basics of the theory, the methods for identifying support and resistance, the types of support and resistance, and the practical uses of these concepts
What is Support?

Support represents a specific price point, where the downward movement of prices can halt or retrace, due to the existence of large buying interests at that price. As an asset’s price decreases to reach support levels, the (demand) for that asset generally increases as the (supply) of sellers that would like to sell at those prices continues to diminish. Therefore, as a result of this imbalance between rising demand and decreasing supply, the asset price stops to decline and may also rise again after reaching that support level.
Support levels are often created because the people who participate in the markets recall instances of compelling buying activity at particular price points. When price comes back to that same level, those past experiences with buying become relevant again and provide a reinforcing effect on the level of support. The more times that a support level has held up in testing, the more ingrained it becomes in the minds of the people trading the market (i.e., collective psychology) and as time goes on, the stronger the support level becomes.
What does Resistance mean?

Unlike support, resistance is the point at which the price of an asset will probably slow down or reverse its uptrend because the amount of sellers (supply) has exceeded the amount of buyers (demand). When you approach the resistance, it’s likely that more sellers (those who are going to sell) will come onto the scene, while buyers (those who are willing to buy) will be less likely to buy these products at higher prices. When this occurs, and the price hits resistance, it will likely either stall or fall.
Similar to support, the resistance level is strengthened and confirmed as an important tool or control level the more it is tested repeatedly. When a price has approached a resistance level several times and has been rejected each time, traders perceive this level as an extremely strong ceiling and, therefore, expect that future attempts will also fail to break the resistance level until such time that the resistance level is completely broken.
The Psychological Forces behind Support and Resistance

Support and resistance are effective because they occur as a result of collective human market behaviour and psychology, and not because of any sort of a mathematically-based Law of Nature. Participants in markets are people with memories, perceptions, and emotions connected to seeing prices change. As the price reaches a level where buyers or sellers have made large purchases in the past, there are many different psychological factors at work.
Firstly, we have the anchoring effect, with traders mentally anchoring to former prices and using those to decide how to make trades. Secondly, traders also experience regret aversion, where an investor who did not buy when there was a lower price previously feels regret, and rushes to buy when the price comes back down again. Lastly, we have stop-loss and limit orders, which tend to be concentrated at specific price levels (e.g., round numbers, previous high prices, previous low prices). When many traders place orders near a similar price level, this creates a self-fulfilling reaction at those price levels.
The psychological reactions that individuals have to this situation are general among people overall. As many people keep following the same pictures and price levels finally, the levels of assistance and resistance get extremely higher focus and dealing activities which continuously solidify their value.
The Development of Support and Resistance Levels
Support and resistance lines can be constructed on price charts in several fashions and, by understanding how they have been constructed, an individual trader can anticipate where the next support or resistance level will occur before it actually occurs.
Old Highs and Lows
The simplest variation of developing support and resistance is from extremes reached on a former price chart. If there was an established low, is “Swing” Low. The lowest price reached within the time period selected. A previous high, is “Swing” High. The highest price met within the selected time period. These are easy to see on a chart and they are watched by many traders, thus making them even more reliable.
Trendlines
Trendlines are defined as linking higher lows in an uptrend and linking lower highs in a downtrend, moving diagonally. The trendlines provide dynamic support or resistance that fluctuates with the overall trend. The ascending trendline is the general support line for price pullbacks of an uptrend and descending trendlines are the general resistance line for price rallies of a downtrend.
Moving Averages
When referring to moving average lines (for example: the 50-day, 100-day, and/or 200-day moving averages), you will find that they provide some form of dynamic support and/or resistance. There are so many retail and institutional traders watching these averages that when prices approach them, they tend to react to them; this creates behaviour that reinforces itself in either support or resistance.
Psychological round numbers and levels
The round numbers (100, 500, 1000, etc.) or other psychologically significant price points serve as either support or resistance because traders often place their orders at these easy-to-remember price levels. This is evident particularly in currency pairs and major indices.
Levels of the Fibonacci Retracement
The Fibonacci sequence is used by trader to determine levels of support or resistance that may exist during a correction or pullback when the overall trend continue. The most common Fibonacci level are 23.6%, 38.2%, 50%, 61.8% and 78.6%. While the validity of these levels has been debated from a blank scientific perspective, they still hold substantial value because so many traders utilize them which results in them being self-fulfilling.
High Volume Nodes and Volume Profile
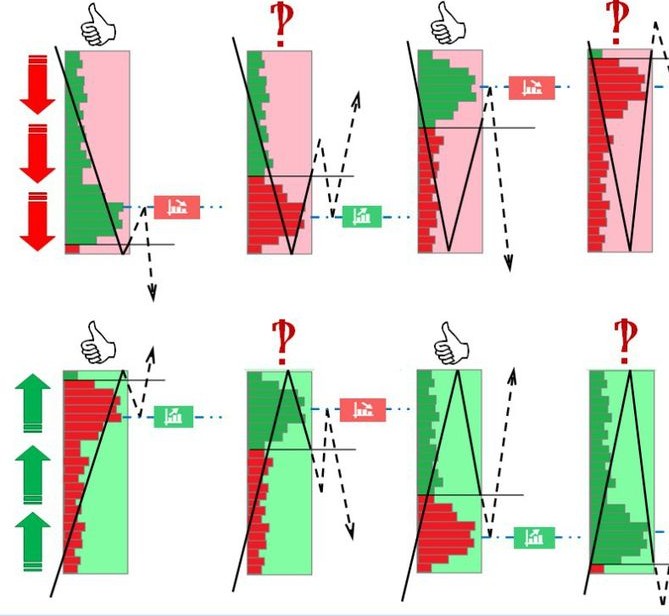
The areas on a chart that showed high trading volume will typically be support or resistance in the future. The Zones are also sometimes referred to as high-volume nodes, which “are price points at which a great deal of transactional activity occurred, meaning that there was a large agreement of value at that price point”.
Support & Resistance Types
Support & Resistance are also categorised into two types: Static & Dynamic.
Static levels are flat/horizontal price values that don’t change. They’re usually taken from the past, like the highest price or lowest price ever reached. These are the most widely accepted form of support and resistance and are easy to locate on a chart.
Dynamic levels move as time goes on. They’re often drawn with trend lines or moving averages. Once created, dynamic levels of support and resistance will move with the security’s price and are therefore helpful in trending markets.
Minor and Major Levels
Not all support/resistance levels are equivalent to each other. There are minor support/resistance levels and there are major ones. Minor support/resistance levels basically represent some very short-term price levels which usually only continue to affect the market for a few sessions, and major support/resistance levels basically represent very large, long-term price zones which will have been tested multiple times over a long period of time. In general, major support/resistance levels would have more significance and would be more likely to produce a large reaction when tested.
The Role Reversal Principle
Support and resistance analysis basically relies on the concept of an interchange of roles. The concept is defined by the phrase: ‘what was resistance would now act as support’, and the other way round as well. When one breaks through a level of resistance convincingly, that level becomes a level of support. This is because the psychological value of the price level remains present even though the price has broken above it. Many traders that sold at that price are upset that they did so, and therefore will attempt to buy if the price drops back down to that level. This reinforces the level as new support.
In the event that the support level is destroyed, it may now turn to be a new resistance during future rally attempts, as the traders who bought at that support level are now at a loss and will, therefore, attempt to sell, or to break even when the price returns to that level. This phenomen of role reversal is among the most dependable and common patterns in technical analysis, and it is also very often being used by traders in designing new entry or exit points after Breakout (breakup) or breakdown (breakthrough).
Strength of Resistance and Support Levels
Support and resistance levels are not all equally strong; there are several factors that determine the strength of a particular level.
The amount of times that a particular level has been tested is an important factor in determining its strength. Typically, the more times a level has been touched (tested) and has held, the stronger that level is considered to be. A nuance of this concept is that when a level is being tested, each subsequent test can weaken the level slightly since each time it is tested, some of the participants that were ready to buy or sell at that price behave have been exhausted this makes it more likely that a break through that level will happen after a subsequent test.
The quantity of trading done around a particular price level is a measure of that level’s strength. Levels created by high volume are very important because high volume signals that many traders were happy with that price, in other words, agreed with it. In contrast, levels created by low volume get less attention because of the limited number of traders willing to accept that price.
The timeframe of the level’s appearance is also significant. Generally longer timeframes like monthly and weekly charts are regarded as being more meaningful than shorter timeframes such as 5-minute or 15-minute charts because of their representation of market sentiment over an extended period of time.
Breakouts and fakouts
A breakout basically occurs when the price of a security moves through everyone’s support or resistance level to a new high or low, and is generally followed by increased volume. Breakouts are important for many reasons, but mainly a breakout will indicate that the price is beginning a new trend or continuing an existing trend. Most of the time traders will use the breakout as an entry signal to buy when the resistance level has been broken or sell when the support level has been broken.
But not every breakout is a true one. In the world of trading, you can sometimes experience a false breakout (a “fakeout”), where the price breaks through a support or resistance level but suddenly returns back into the range it was previously trading in. This can cause traders who buy or sell because of what seems to be a breakout to get caught in bad trades if the price reverses and goes against them.
Traders usually wait for confirmation before making trades to lower the likelihood of trading based on a false breakout. This confirmation can come in multiple forms, including but not limited to, waiting for the price to close above the breakout level on either a daily or weekly basis, as opposed to an intraday breakout; confirming with a large increase in volume; and waiting for a retest of the previous resistance (now support) level or vice-versa to prove it is now performing its new support or resistance function.
Applications of Support and Resistance in Real Life
Entry and Exit Point Settings
Support levels are generally used as potential buying points while resistance levels are used as potential selling points in range-bound markets. The breakout of price above the resistance level or below the support level can be used as an entry signal to take a position in the direction of price after a breakout.
Placement of Stop-Loss Order
Support and Resistance (S/R) levels are the most popular points for setting stop-loss orders. Traders, generally set the stop-loss order for a buy trade slightly below the S/R level, since breaking through the support indicates that the bullish bias is no longer valid. On the other hand, traders place the stop-loss order for a sell trade slightly above the S/R level, since after breaking through resistance, there is no longer a bearish bias.
Risk-Reward Calculation
For the trader to calculate the risk and reward associated with any specific trade, the saving the distance between the entry point of the trade and the nearest area of Support and Resistance. The reward expected for a trader needs to justify the risk. With this, the trader will stay disciplined and use the approximate position size during the trading activity.
Confirmation of Trend
The creation of new high points and new low points, the creation of new low points and lower high points, all relate to the support and resistance areas, and they are all used by traders to determine a markets current upward trend, downward trend, and/or a range-bound trend (i.e., the market is trading sideways).
Support and Resistance Limitations
Even though support and resistance can be strong indicators for traders to use when trading in an uptrend or downtrend, neither one is perfect in every situation. Because the support and resistance levels are calculated from previous prices and from the way that people perceive them, rather than from mathematical equations, there are occasions when these levels will not hold and will instead break down quickly with either very high volatility or with unexpected news about an asset or a major change in how the market as a whole looks at an asset.
Furthermore, defining the exact point support and resistance are placed on a chart will also vary depending on the individual trader, along with the data points amd time frames used to establish those support and resistance levels is what makes them separate from one another. Given the subjective nature of support and resistance, they should be combined with other technical indicators, including volume analysis, momentum oscillators, and candlestick patterns, instead of using them alone.
Conclusion
Support and resistance will always be fundamental to technical analysis because they represent the emotions of traders and also the repeating patterns of supply and demand that cause prices to move. By identifying these levels (e.g. prior highs and lows), trendlines, moving averages, round numbers, etc. traders can better anticipate when the market will likely reach a turning point or break through a support or resistance level. Knowledge of the principle of role reversal, understanding what will make the support/resistance level stronger (or weaker), and being aware of the possibility of false breakouts will all help traders develop an effective and informed trading strategy. Support and resistance are not an exact science but, when combined with proper risk management and other confirming indicators, it is one of the most important skills that any trader can use to learn to trade the financial markets in a disciplined and successful way.