Types of Timeframe in Trading: 3 Powerful Strategies Win
Learn the types of timeframe in trading including 4-hour, 1-hour, and 15-minute charts for effective multiple time frame analysis.
Types of Timeframe in Trading:
If you’re just starting out as a trader you’re probably going to see all of the different timeframes (for example: 1 minute, 15 minute, daily, weekly, etc.) when looking at a chart and be totally overwhelmed by all of the different options. For most new traders, it’s the choice of which timeframe they’re going to trade on that will be one of the most significant, but they totally disregard that when they’re first starting out, and they’ll pick what they think looks cool and then they’ll be shocked as to why their trades don’t work out!
Types of Timeframe in Trading
Fact: Your trading timeframe is the foundation of your strategy. It is a primary factor in how you view the market; how long you will be in a trade; how much pressure you will feel; and, ultimately, how much money you make or lose. This article will cover all of the major trading timeframes and give you an idea of who each trading timeframe is best for, so you can select a trading timeframe that works best with your lifestyle and trading goals.
Types of Timeframe in Trading
What exactly does a timeframe mean when it comes to trading?
The trading timeframe is also known as the chart timeframe and/or the time interval, and it represents the time each candlestick or bar represents on your chart. So if you select a 1 hour timeframe then each candle will show you the price movement that occurred within that one hour timeframe, i.e., the open, high, low and close for that hour.
Types of Timeframe in Trading
The range of timeframes include seconds up through monthly. The shorter timeframe will provide you with more information (or noise) while the longer timeframe gives you a clearer picture but with fewer trades available.
Types of Timeframe in Trading
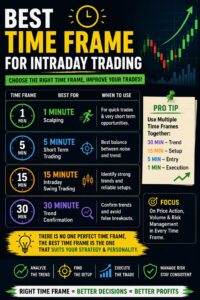
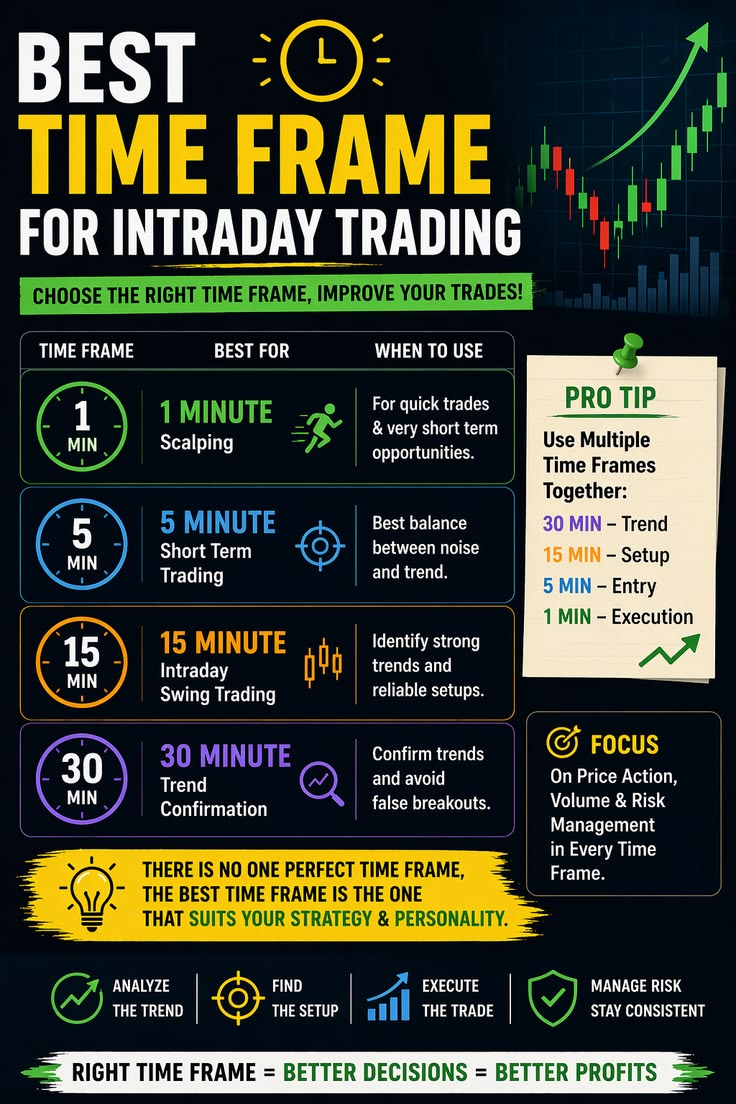
The majority traders typically use three categories of timeframes:
Short-Term (Intraday): 1-Minute to 15-Minute Chart
Medium-Term (Swing): 1-Hour to 4-Hour Chart
Long-Term (Positional/Investing): Daily, Weekly & Monthly Chart
We can now go through each of them one at a time.
Short-Term Charting Timeframes (Short And Sweet)
One-Minute Chart :
The 1 minute chart is the “highest voltage” trading arena. Each candle is 60 seconds of price action. The scalpers are really into this chart because they can squeeze multiple trades out of a single day using this chart which allows them to look for small price movements of 5 to 10 paise or a few cents at a time.
Types of Timeframe in Trading
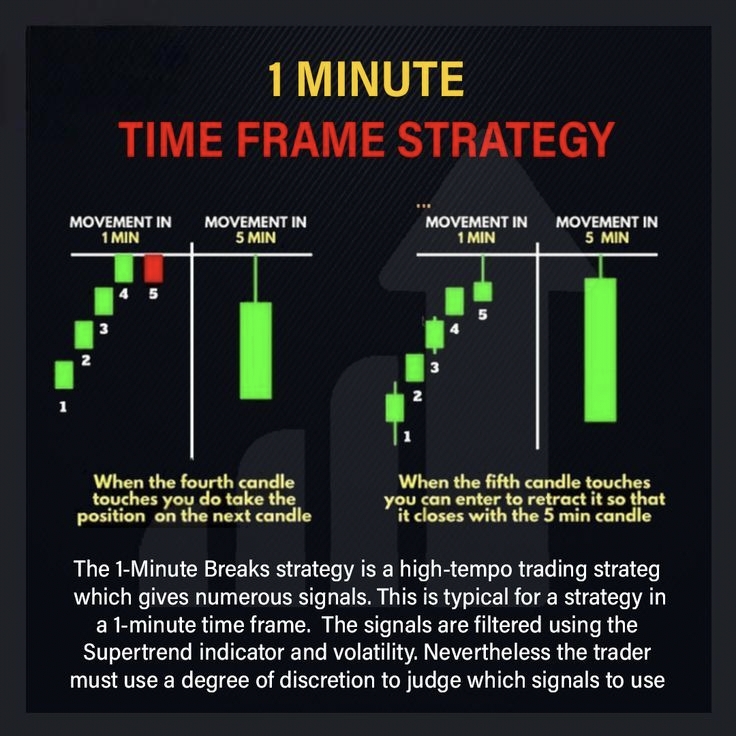
But here’s the deal, the one minute chart is really messy. You’ll see random moves in price, sudden jumps and drops in price, and lots of fake signals. When you trade off of this chart, you need to be able to make decisions very quickly and must have a lot of self-discipline to control your nerves – basically, you need to be like a robot! If you hesitate, you miss the trade!
This duration is extremely difficult to trade, even for advanced traders. If one is not vigilant, the cost of transactions (including commission and slippage) can significantly diminish profits. When one selects the 1-minute chart for trading purposes, he/she spends large amount of time in front of computer and cannot leave the trading screen.
Types of Timeframe in Trading
5-Minute Chart :
The 5-minute chart can be combined with analysis of volume and major support and resistance levels to create a very effective trading tool. When trading on this particular chart timeframe, most trades will typically last from several minutes to an hour. This makes it a great choice if you like the excitement of making quick trades, without having to watch a one-minute chart the whole time.
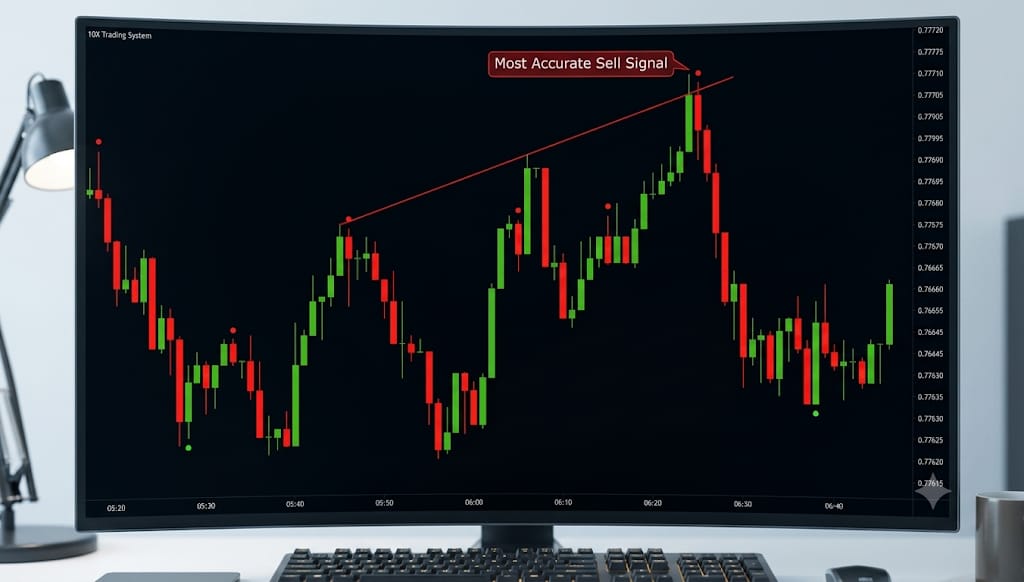
A lot of the important, heavy duty intraday traders use the 15 minute chart to look for most of their main trades. Basically, it’s less noisy than the shorter timeframes, but there are still lots of trades in one trading day.
Head and shoulders patterns, flags and triangles tend to be more reliable on a 15-minute chart than on a 1-minute chart. For individuals entering intraday trading for the first time, the 15-min chart provides a good place to start. It will require discipline to watch it but will not become as cumbersome as lower timeframes.
Types of Timeframe in Trading
Medium-Term Timeframes: The Sweet Spot:
1-Hour Chart :
Many professional traders find that the one hour chart is one of the most balanced timeframes they can look at. An individual candle represents a 1 hour duration of trading. This provides enough information to determine meaningful trends without being overly noisy.
Depending on your strategy, trades on the 1 hour chart can last from a few hours to a few days. Traders can use the 1-hour chart to take trades that do not require the trader to watch the charts all day but allow him (or her) to actively participate in the markets. The 1-hour chart is great for finding the direction of the trend, identifying important levels and timing your entries.
Types of Timeframe in Trading
To get a broader view of the market, most swing traders look at the 4hour chart and use the 1hour chart to get into or out of a trade. Using both charts in that way is very effective.
The 4hour chart is the “swing-trading” chart that almost every swing trader uses as their regular timeframe. Every candlestick on this chart shows four hours worth of price data; therefore there will be fewer candles but they will be of higher quality. Also, it is easier to spot trends and false breakouts will happen less often.
A 4-hour chart trade usually takes between 2 days to more than a week to complete. The 4-hour chart is a great option for those who have a full-time job and only check the markets a couple of times a day. You can simply determine your trading levels in the evening, set your trades, and let the market do the work.
Four-hour charts are technically friendly to indicators, such as Relative Strength Index (RSI), Moving Average Convergence/Divergence (MACD), and Bollinger Bands. Accordingly, four-hour charts are popular for technical traders.
Types of Timeframe in Trading
Long-Term Plans: Waiting Brings Rewards
Daily Chart :
For those interested in trading or investing seriously, most investors and traders study the daily chart first to develop trading or investing strategies. The candles that make up a whole daily rough chart, represent one single day worth of trading activity. Observing the daily chart can provide a picture of how the price has acted at some point during a period that can be measured in weeks, months, or even years.
Types of Timeframe in Trading
Successful traders, even intraday traders, will check the daily chart before determining how to trade, because the daily chart can tell you the general trend. When you trade in the direction of the trend on the daily chart, you greatly increase your chances of successfully trading in the shorter time frame.
Positional traders will often hold trades over several days or weeks and will use the daily chart as their primary tool. Because of this, it can help cut down on the amount of time traders spend watching their screens, making emotional decisions and searching for good trading setups on the lower timeframes. If you want to be a trader that is still able to trade actively but can’t spend large amounts of your time trading every day, using a daily chart will definitely benefit you!
Types of Timeframe in Trading
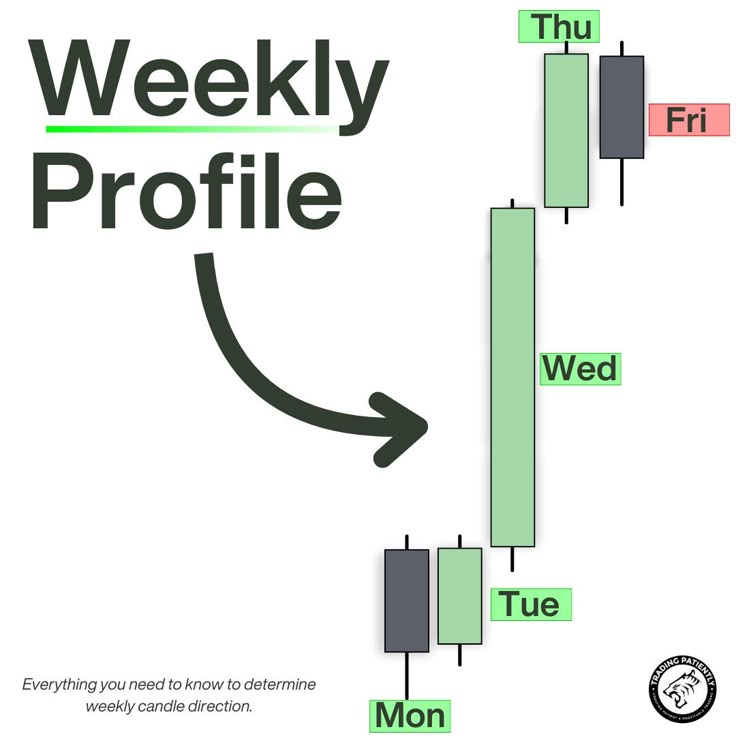
Weekly Chart :
A weekly chart is most commonly used by long-term investors and positional traders. The candle shown on the weekly chart covers a period of one week of trading. The benefits of using a weekly chart include identifying significant support and resistance levels, identifying the direction of the overall trend over the long term, and identifying important reversal points.
Types of Timeframe in Trading
Hedge funds, professional market participants, and experienced market participants use the weekly chart as a primary tool for making strategic decisions. For retail traders, it can assist a trader in dodging short-term noise and looking at greater opportunities out there.
The trades that are made through the Weekly Charts remain active for a time from weeks until months. Weekly charting requires the trader to be patient and can be very helpful for those who are also looking to trade at a slower pace, meanwhile, the weekly chart gives traders some of the cleanest signals that you can find.
Types of Timeframe in Trading
Monthly Chart :
I consider the monthly chart to be the primary time frame. The candle on the monthly is an entire year’s worth of price action in a single candle. Generally, it is only used for long term analysis purposes. Using multi-year trends, multi-year trend lines/massive resistance or support levels, major trend reversal points, etc., are are all actually analysed using the monthly candle.
Retail traders won’t be actively trading on the monthly time frame. However, they all need to actually understand the monthly time frame/analysis. If you find a stock that has an upward trend for a long period of time (i.e., a strong solid upward trend) on a monthly chart, then that stock would generally be the safest option for any type of positional investor
Types of Timeframe in Trading
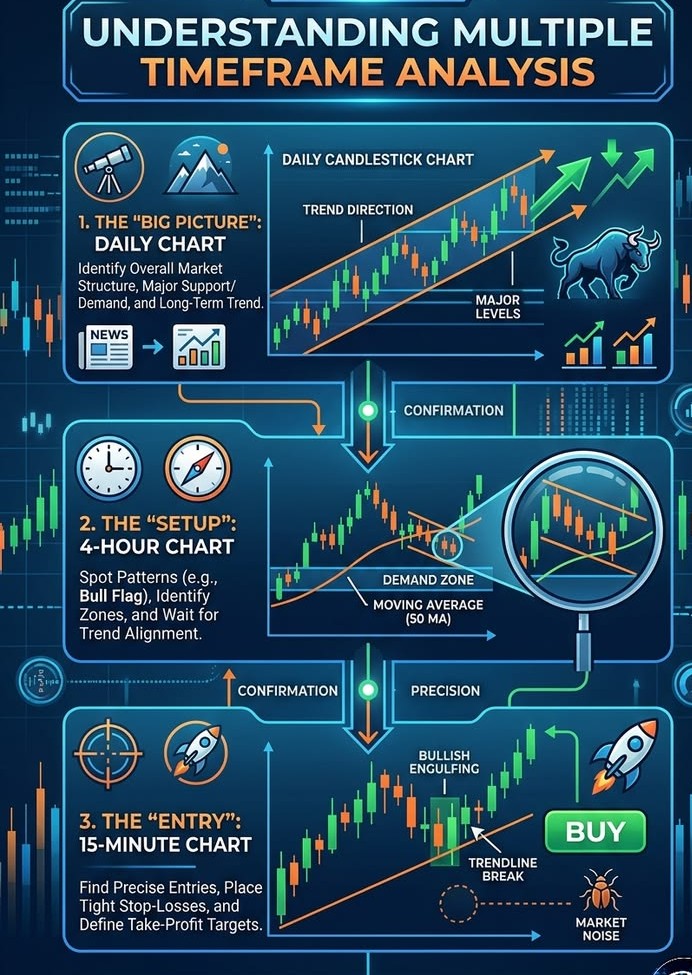
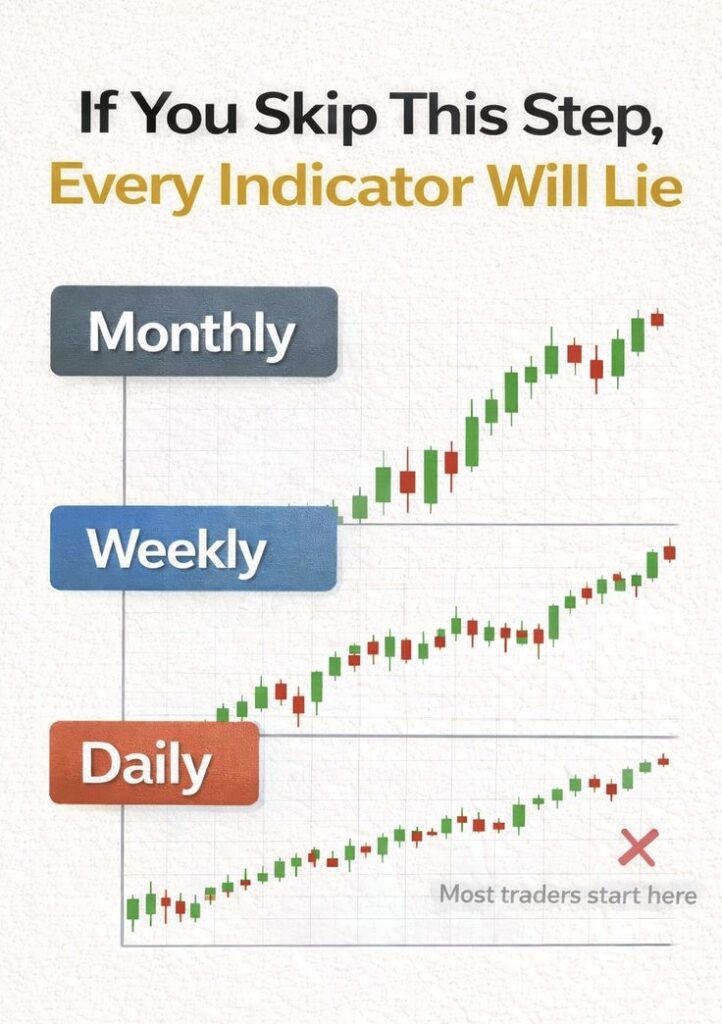
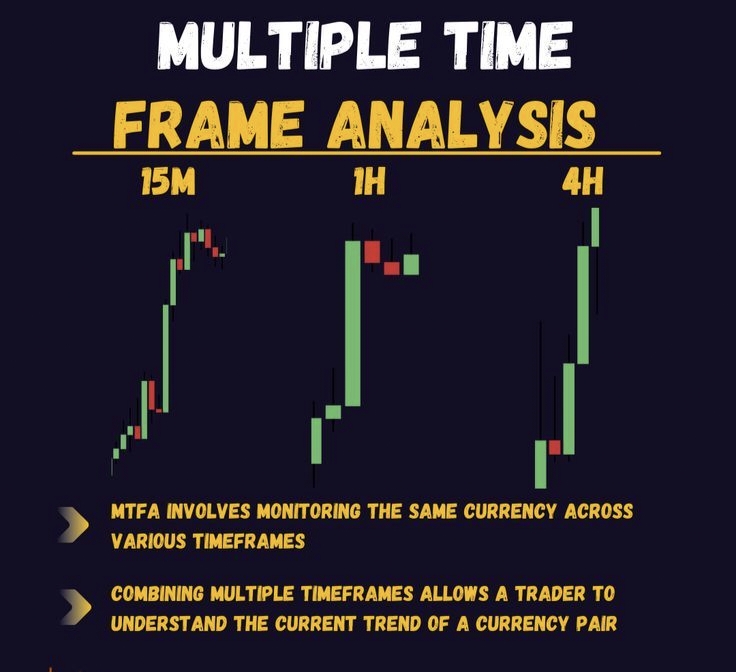
Multi-Timeframe Analysis: The Professional Edge
One thing most novice traders may not even know about professional trading is that pros don’t rely on a single timeframe, they utilise several different timeframes at once; this will generally be referred to as “multi-timeframe analysis (MTF)”. This is how professionals analyze and trade markets with an edge.
Types of Timeframe in Trading
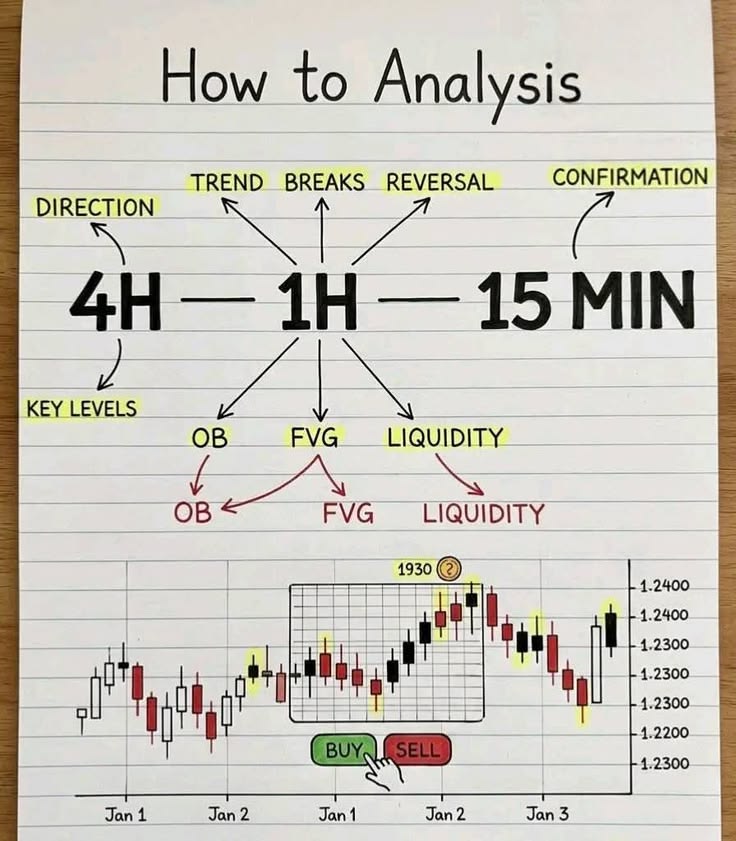
Standard method of this is :
Higher Timeframe (HTF): Identifies the overall trend and key levels (e.g. Daily or 4-Hourly Chart)
Middle Timeframe: Provides context and confirms your setup (e.g. 1-Hour Chart)
Lower Timeframe: Provides a entry point and get the best possible risk-to-reward (e.g. 15-Minute Chart)
Types of Timeframe in Trading
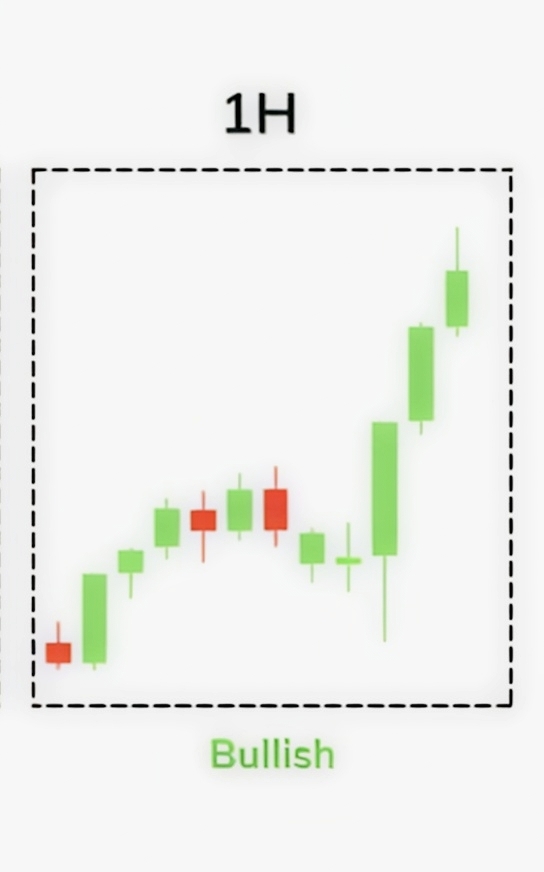
Example: Daily chart shows stock in strong uptrend and has pulled back into Support Zone. Zoom into 1 hour chart for Bullish Reversal Pattern. Once you identify this pattern, you then enter trade at 15 minute chart when Bullish Confirmation Candle is formed.
Types of Timeframe in Trading
This method will Filter out Bad Trades and Greatly Improve your Accuracy of Entry.
How to decide which timeframe is right for you
The timeframe shouldn’t only entice you, but it needs to be congruent with your lifestyle, personality, and available funds as well.
Think through these questions:
How long do I have each day to devote to trading? If your only time is for 30 minutes after your workday we’d say that Intraday trading, is certainly not going to be possible within that time. In such a case, a swing or position trading approach using Daily or 4 Hour charts would likely be best.
Do I experience stress? If you experience stress with rapidly changing market conditions, do not consider 1 to 5 minute charts. Consider a longer timeframe, because a longer time frame will give you more time to think.
Types of Timeframe in Trading
How much money do I have to invest? Scalping needs a lot more money than other trading methods; in contrast, it also requires very low commission costs from your broker. If you’re starting out with limited money it’s a lot easier to manage risk with swing trades.
Am I emotionally disciplined? The shorter the timeframe in which you’re trading, the quicker you’ll need to make trading decisions and the better you’ll need to control your emotions. If you’re learning to be a disciplined trader, start out trading off of daily charts and/or 4 hour charts.
Types of Timeframe in Trading
Final Thoughts :
Trading does not have a single “best” time frame, but rather, traders should select the time frame that is most suitable for their style of trading. For many beginner traders, they find 1 minute charts to be exciting and fun to watch. However, most beginners ultimately lose money using shorter time frames like the 1 minute time frame. A 4 hour or daily chart will help new traders develop the discipline necessary to understand clean price action, along with the process of developing solid trading decisions.
Types of Timeframe in Trading
Gain proficiency in one timeframe before expanding to multiple ones. Learn to understand how prices move in that timeframe, develop a repeatable methodology for successfully analyzing and trading in that timeframe, and after you have identified that a strategy for analyzing prices on one timeframe can be done successfully with multiple timeframes, then you should consider starting to expand your trading techniques to encompass multiple timeframes. The traders who are going to succeed in the long run will be creating the patience and discipline they need to win as well as creating processes that will work for their lifestyles.
Types of Timeframe in Trading
Choose wisely (time) and trade consistently; let time be on your side in the process of trading.
The information in this article is provided for educational purposes only and does not constitute financial advice.